We have already seen how a loop can be used to iterate over a block of code to create a repeated pattern.
For example, consider this Sonic Youth gig poster:

When analysed upon a grid, we can see that repeatedly drawing partially transparent circles will produce the desired design:
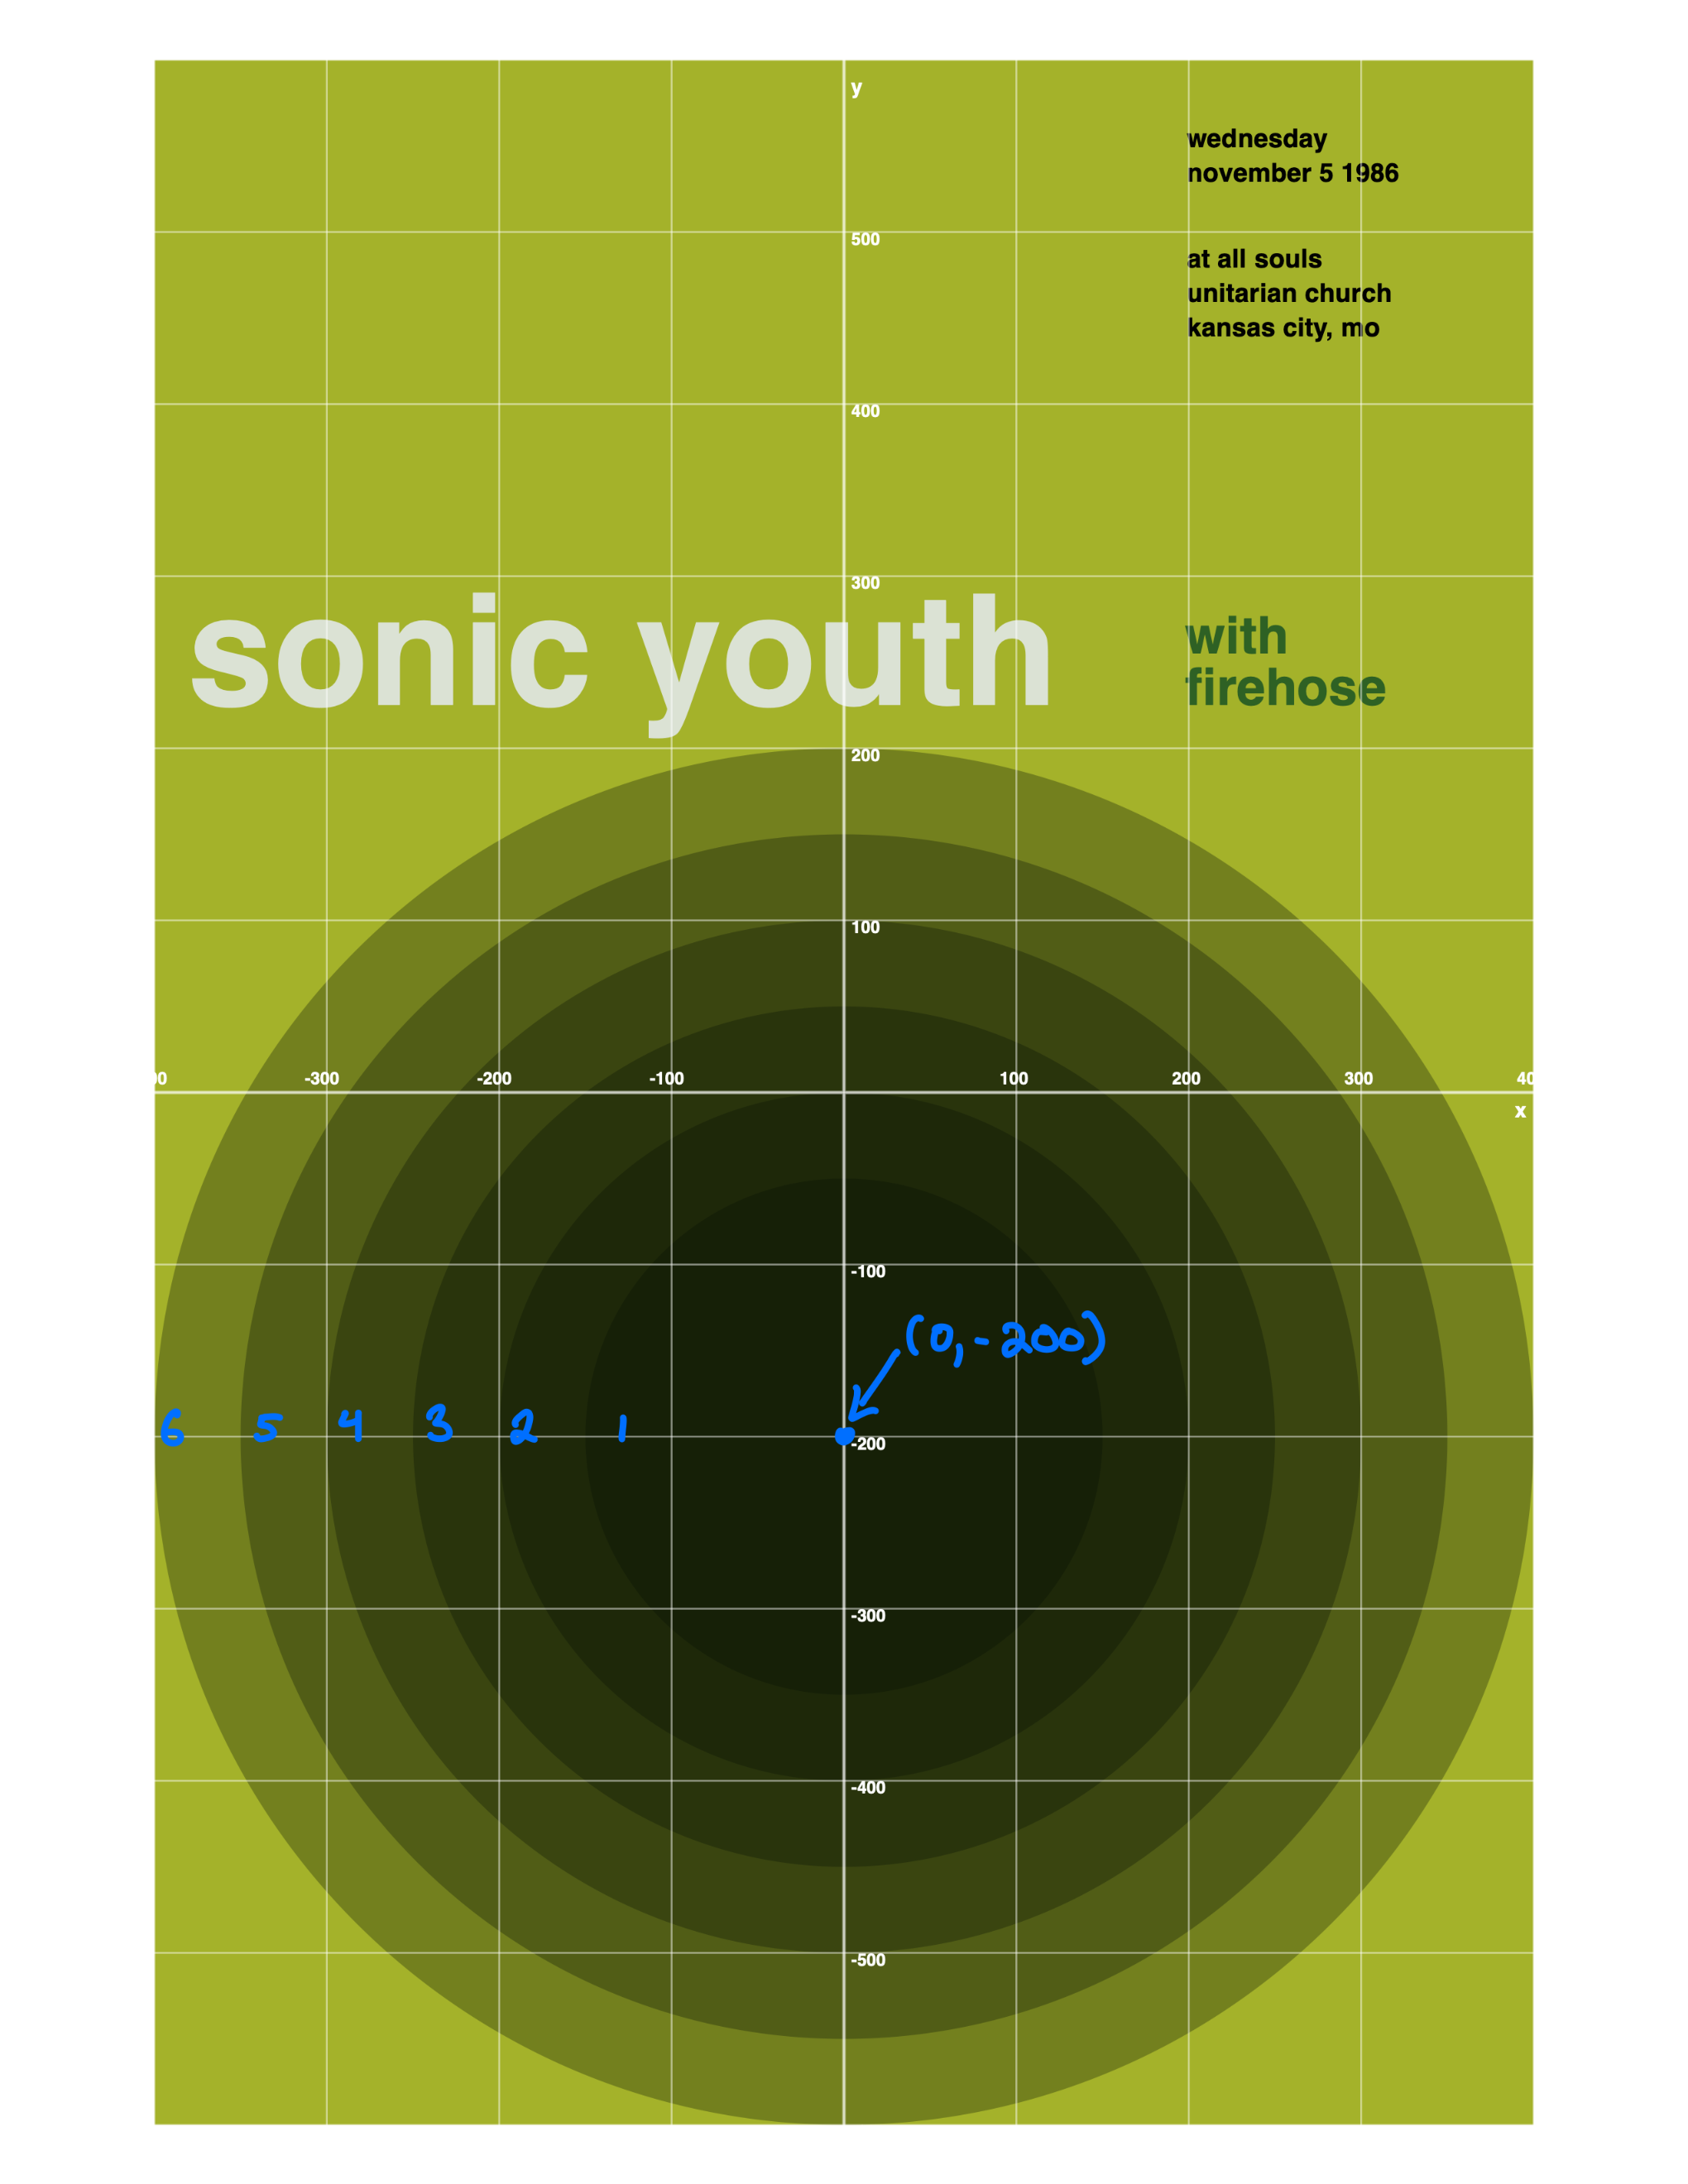
The pattern is that the width of the circles changes. The first circle has a width of pixels, the next pixels, and so on… up to and including a width of pixels.
This can be expressed with the following for loop:
for i in stride(from: 300, through: 801.0, by: 100.0) {
    turtle.drawEllipse(at: Point(x: 0, y: -200),
                       width: i,
                       height: i)
}
… where the variable i that is created by the loop is used as the argument for the width and height parameters when invoking the drawEllipse function.
All of this is illustrated in the following super-short video:
Going loopy
One loop is great, so why not have two? 🙂
Consider the following gig poster for Refused:
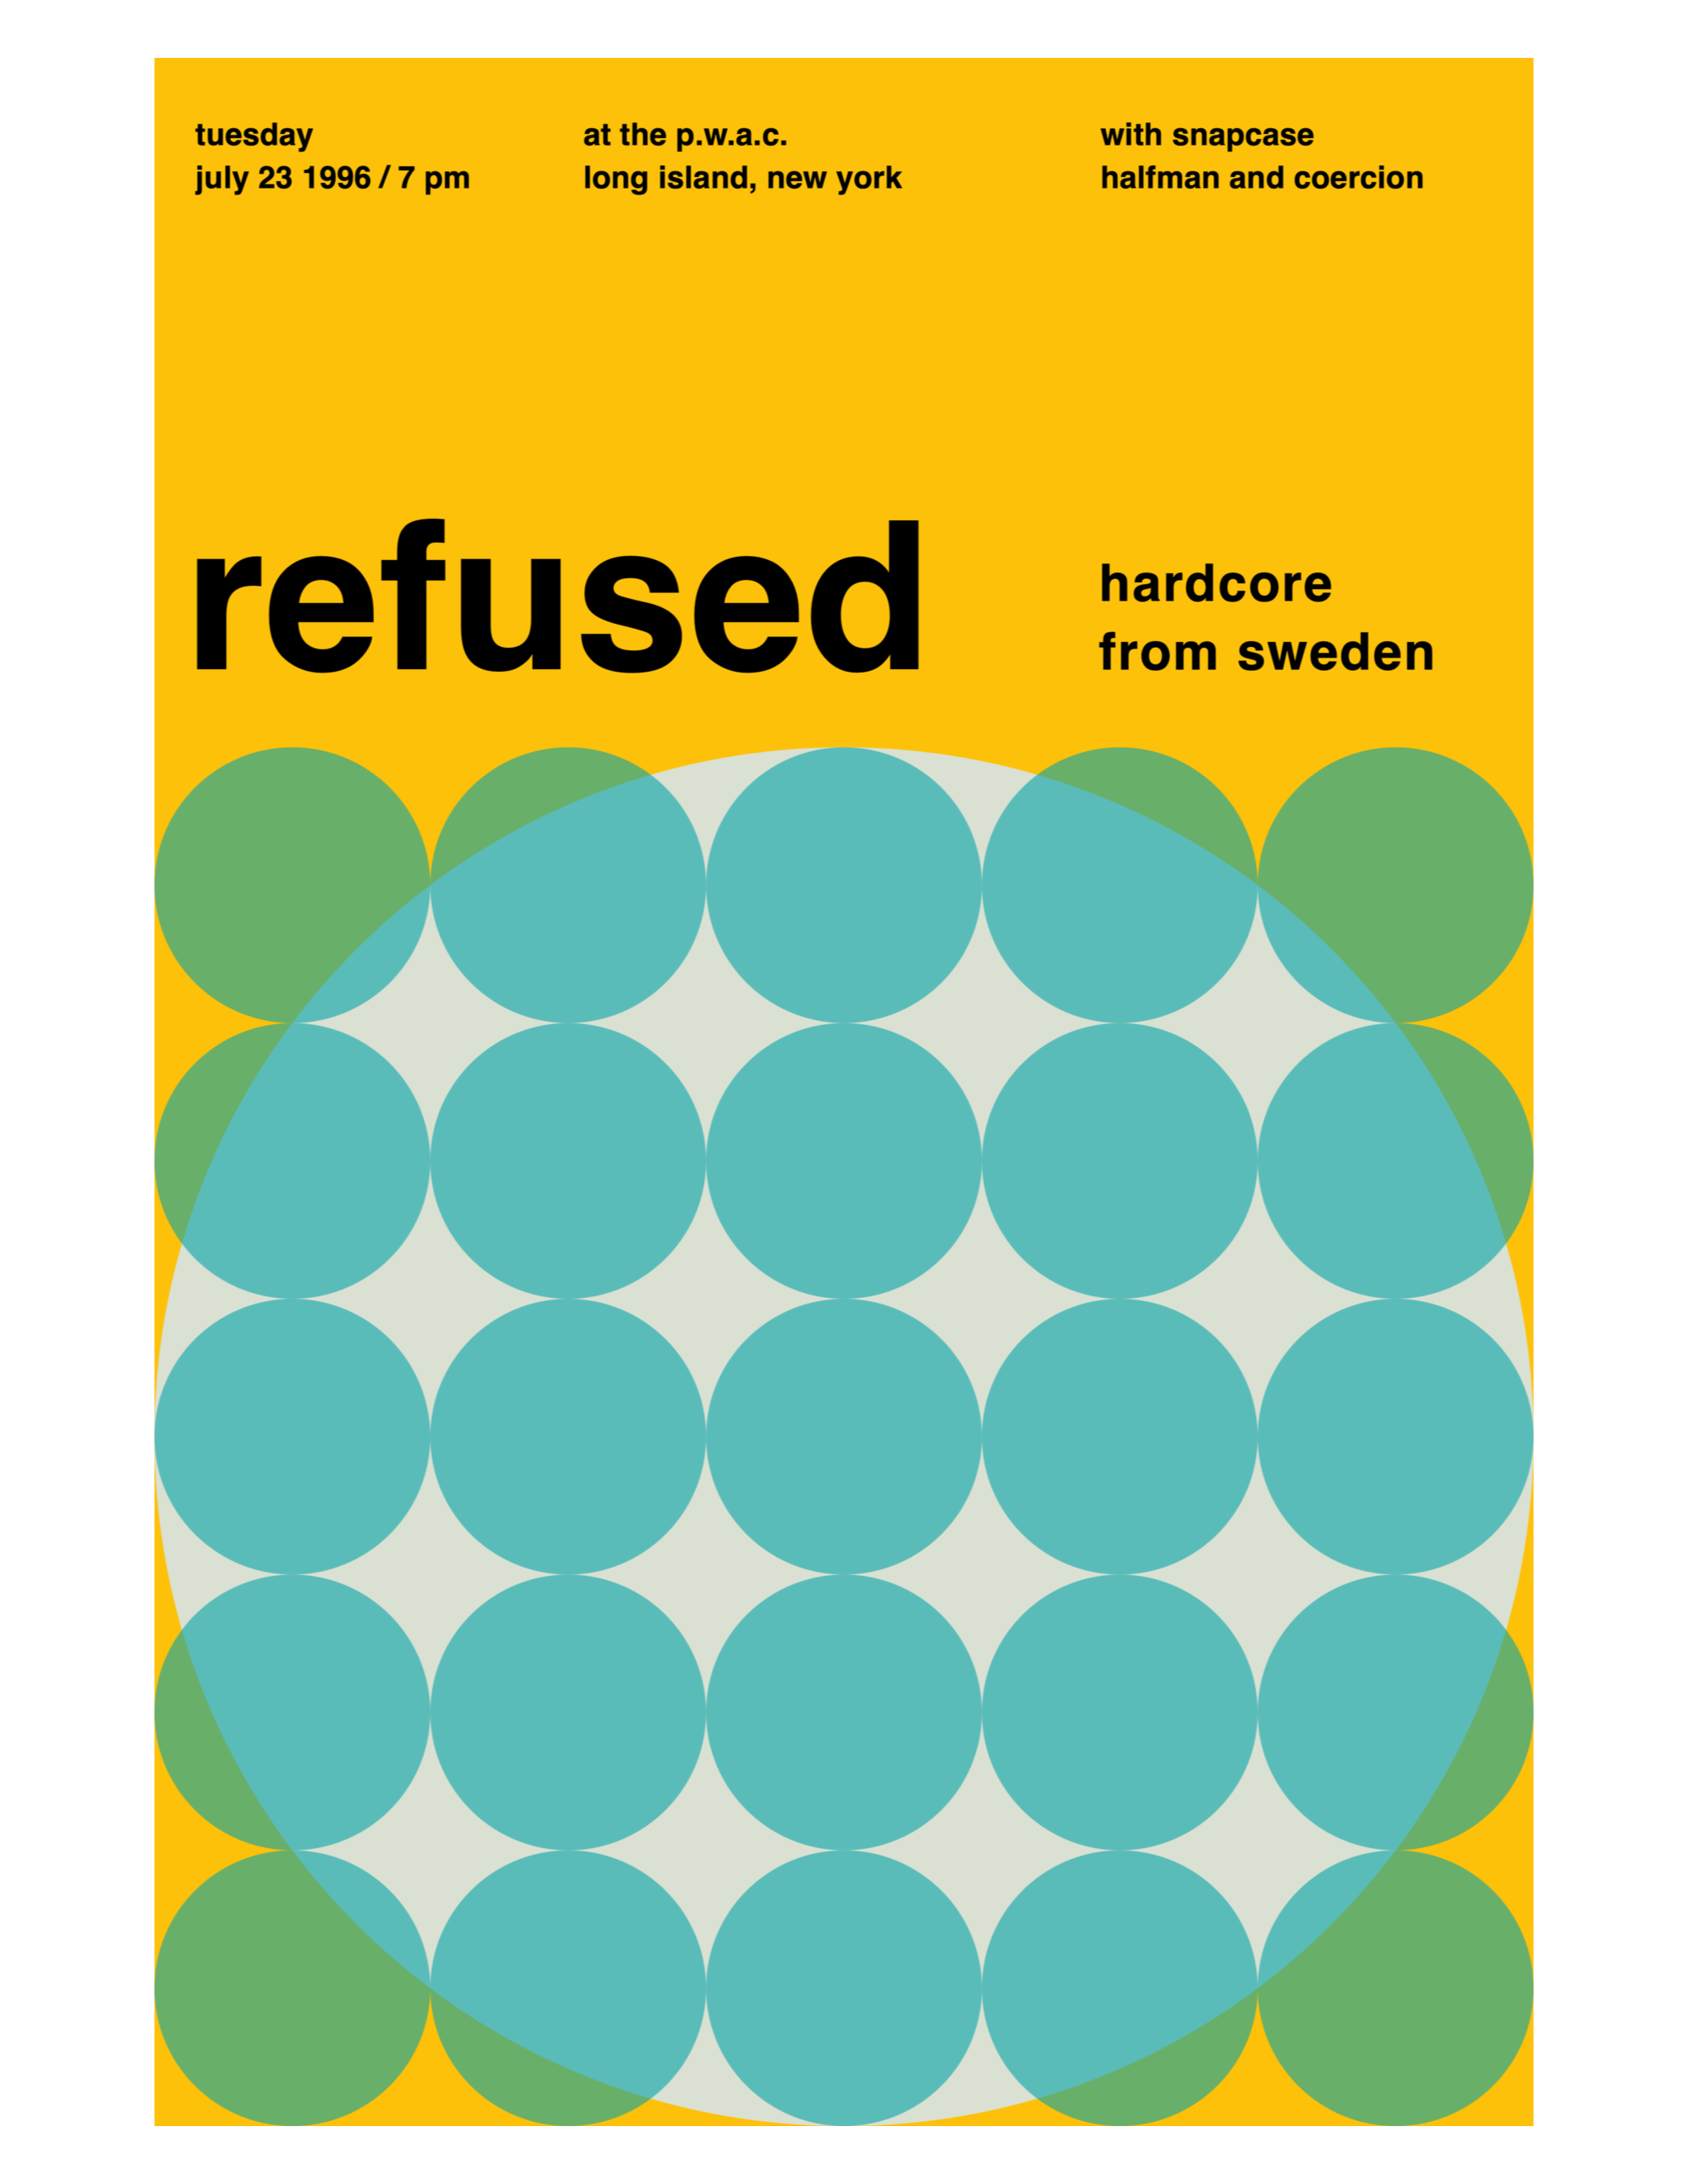
Here it is viewed with a grid:
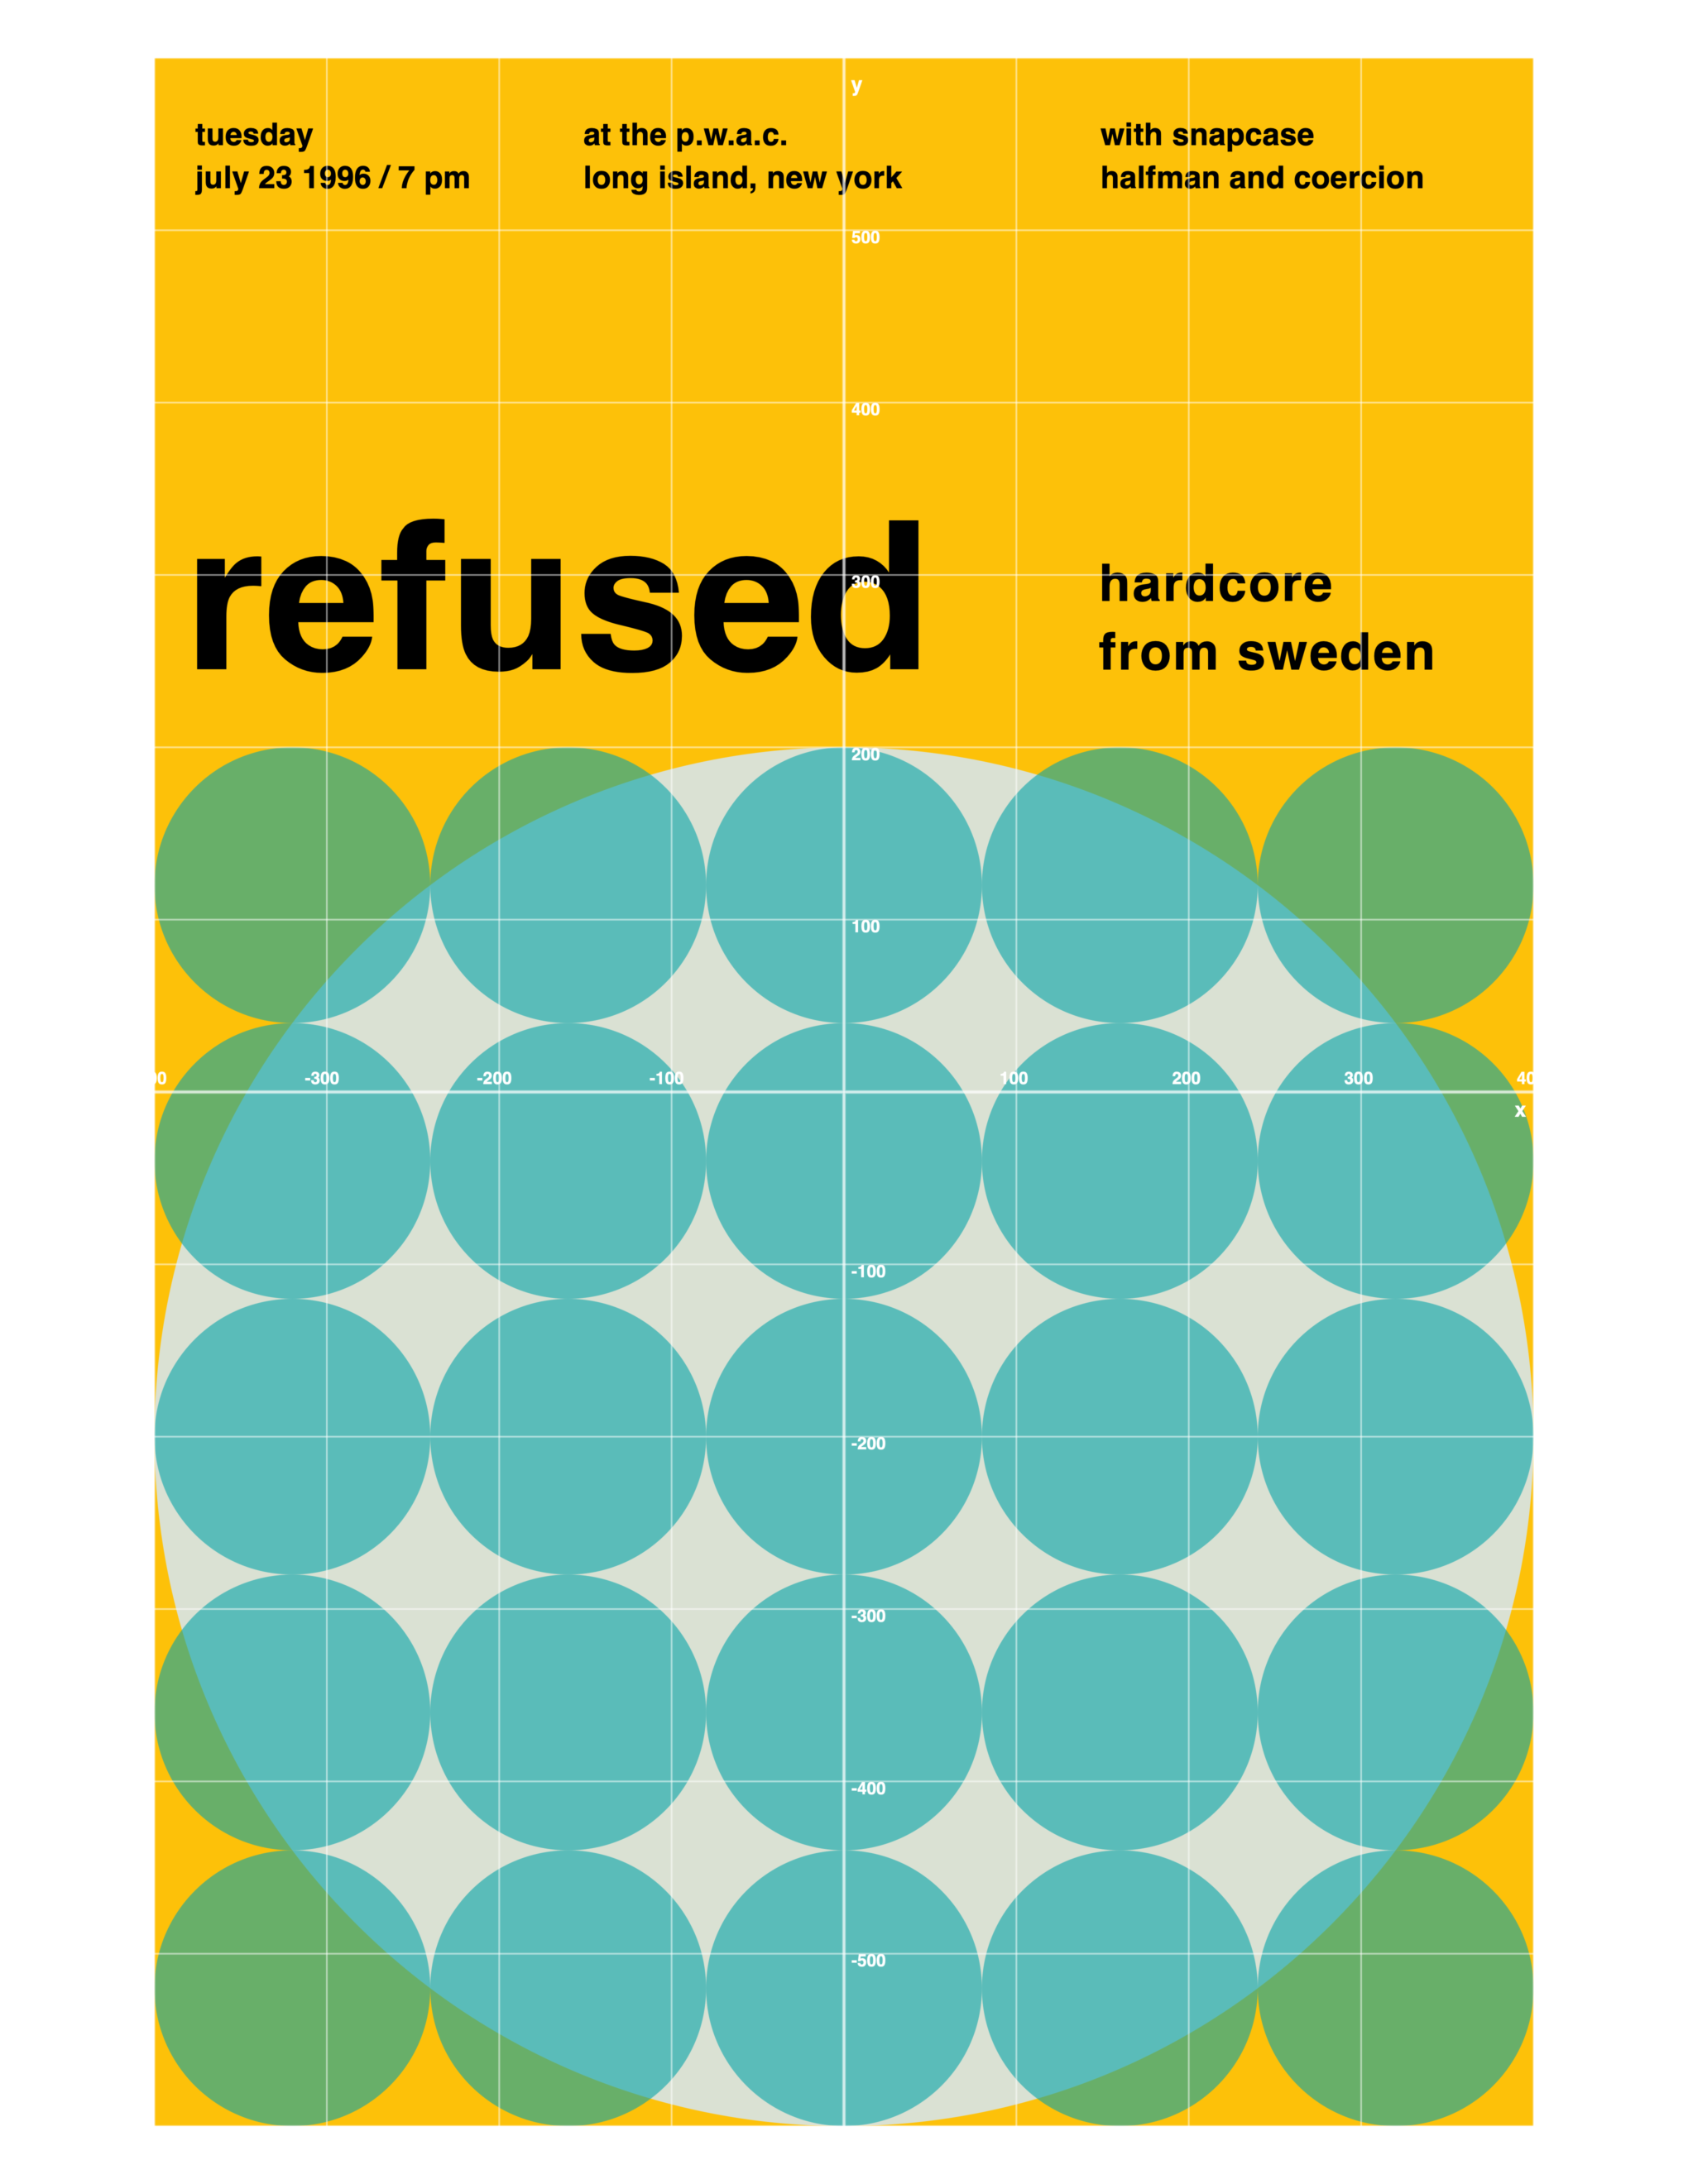
The grid allows for some analysis to occur:
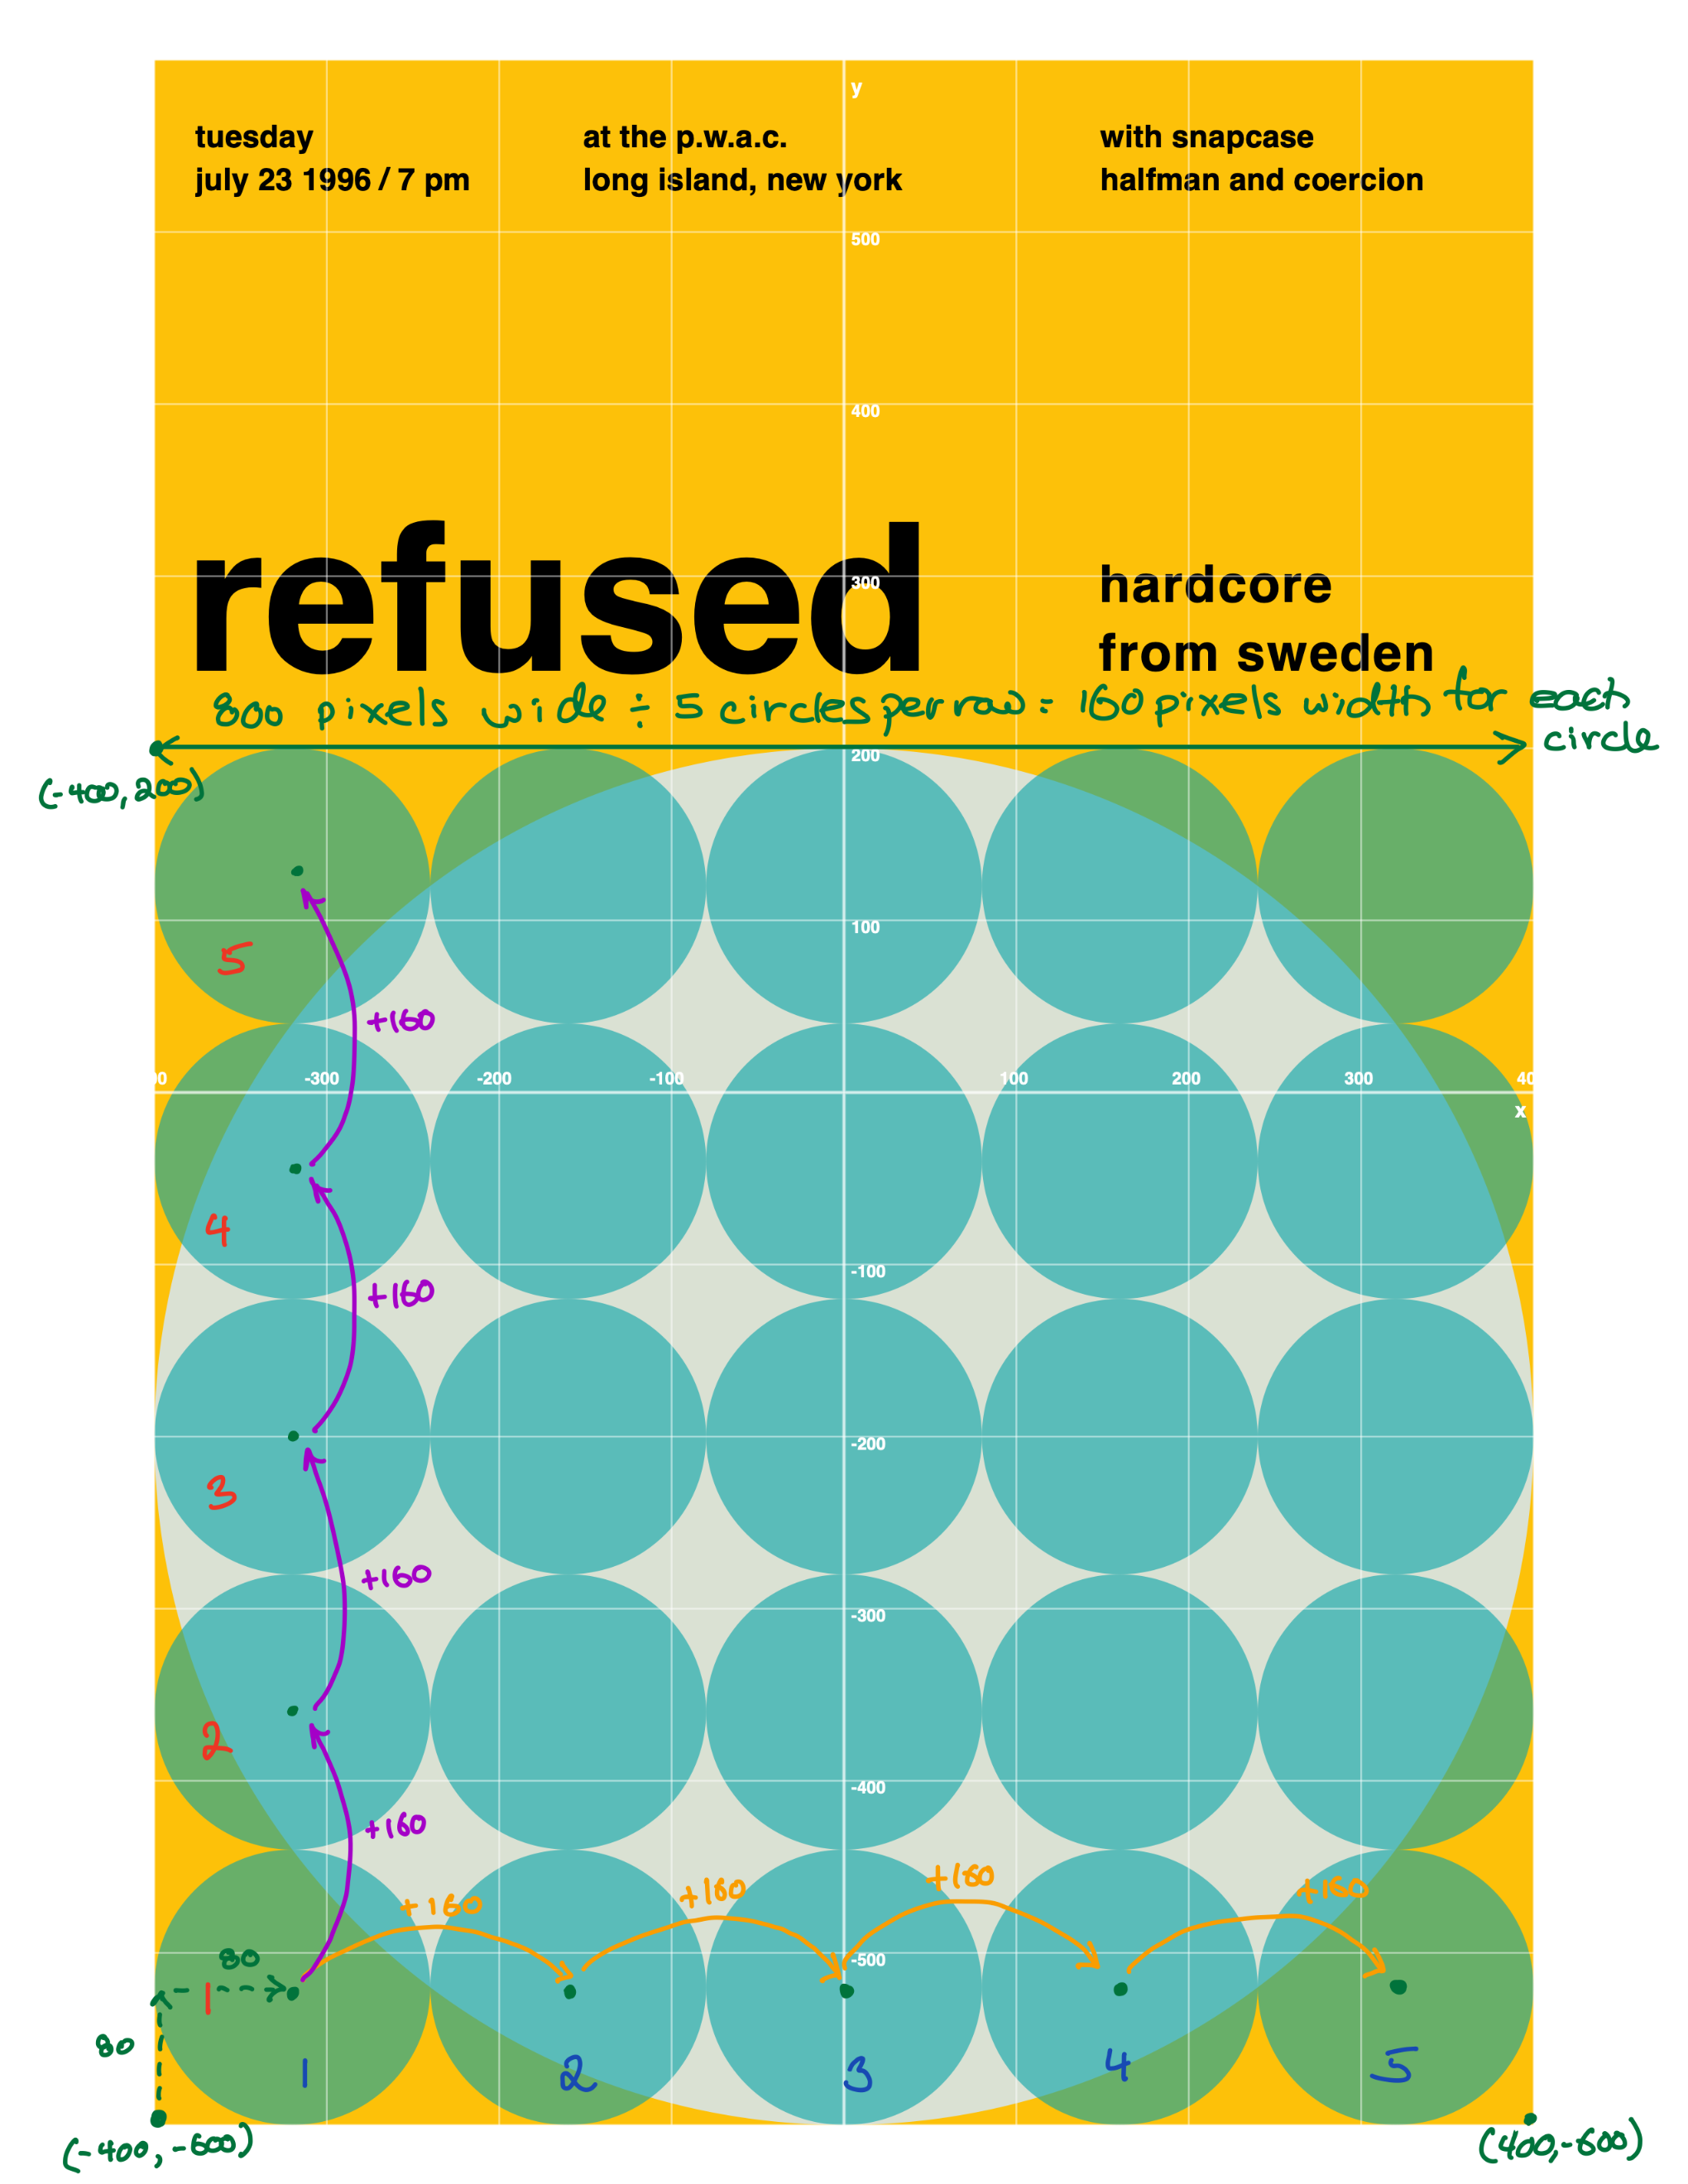
By recognizing that the width of the poster is pixels, and that there are five circles in a row, we can determine that the width of each circle is pixels:
We know that circles are anchored at their centre point.
Half of is .
Therefore the centre point of the first circle in the bottom row must be inset pixels from the left side of the poster.
This is shown by the dotted green arrows on the plan – look at the bottom left corner:
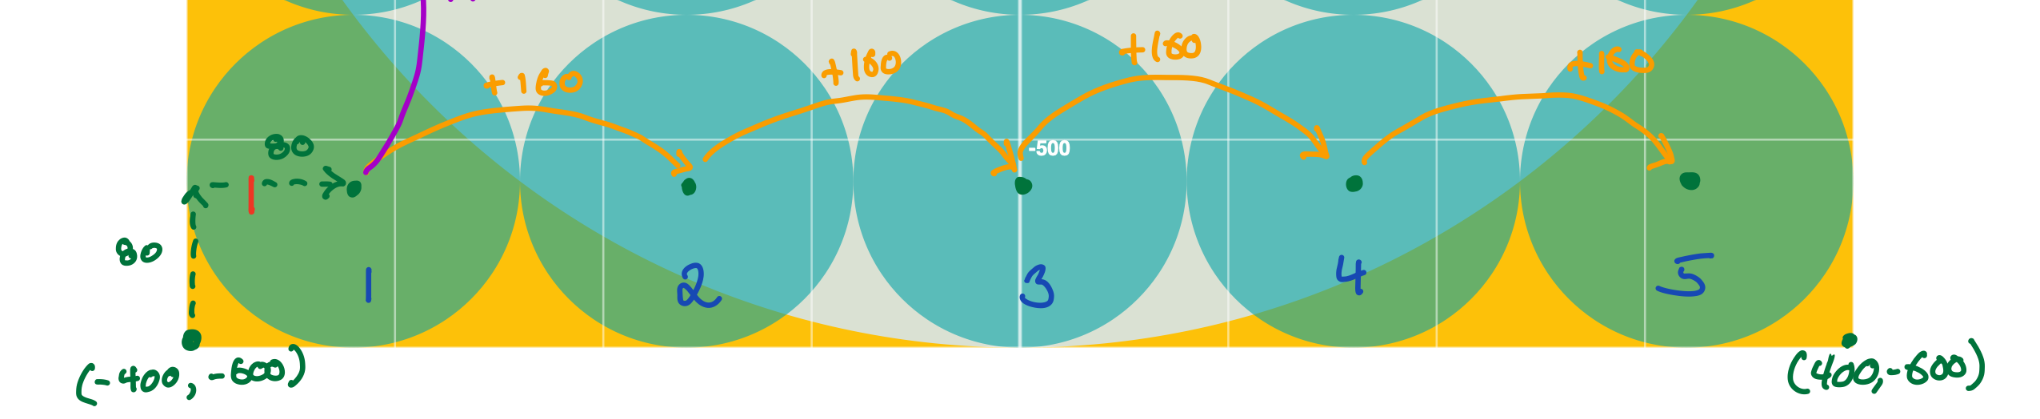
We can express the horizontal positions for the circles using a for loop with the stride function:
for i in stride(from: -400 + 80,
                to: -400 + 80 + 160 * 5,
                by: 160) {

    turtle.drawEllipse(at: Point(x: i,
                                 y: -600 + 80),
                       width: 160,
                       height: 160)

}
Let’s break that down.
-
The argument for the
fromparameter is . We start the expression with because that is the leftmost edge of the poster. We add because that is half the width of the circle, and circles are anchored at their centre point. -
The argument for the
toparameter is . We start with because that is the centre of the first circle in the row. We add because that is the width of five circles. -
The argument for the
byparameter is because that is the width of a circle.
All of this makes the loop create the following sequence of numbers:
We use these numbers to position each circle horizontally:
You can see the result animated here:
We don’t have to do the arithmetic ourselves – we just have to spot the pattern – and then describe that pattern in the code we write. 🎉
Add the second loop
The same type of logic applies the the vertical change in position of the circles:
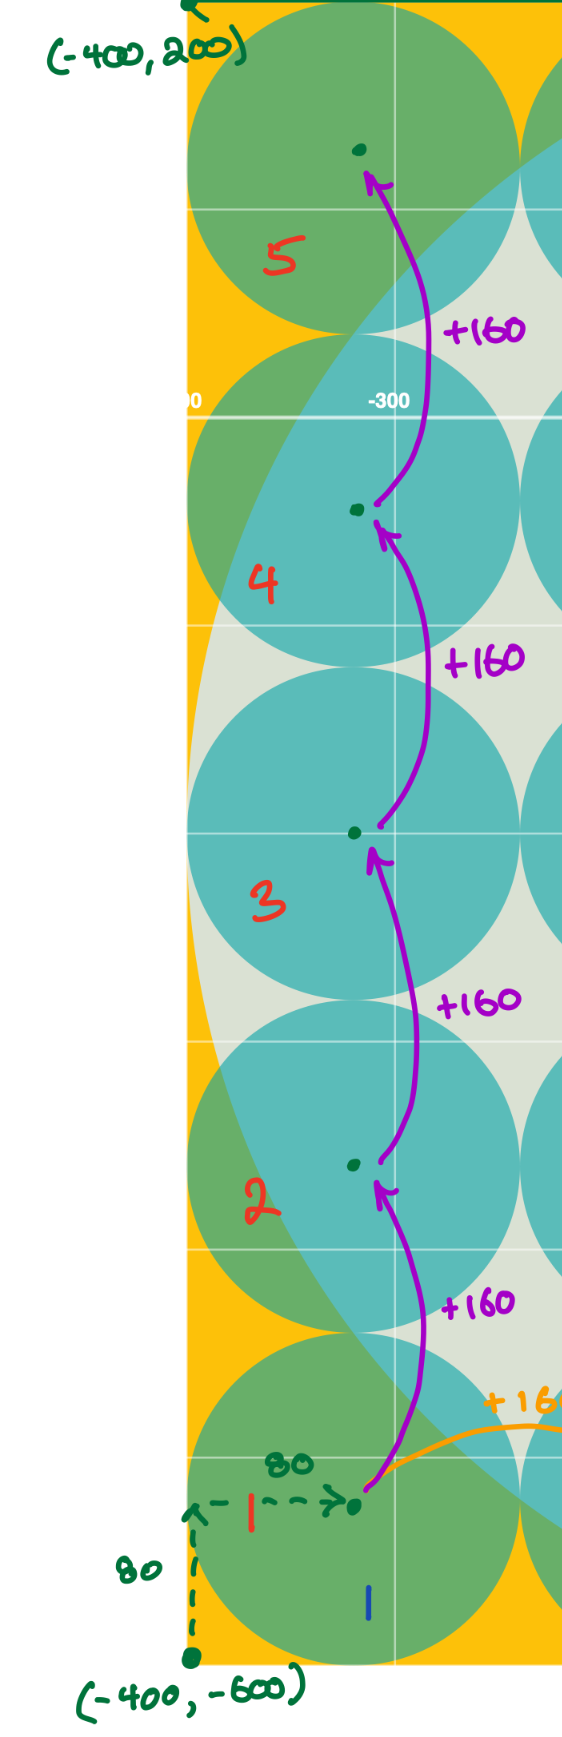
We can express the vertical positions for the circles using a second for loop with the stride function:
    for j in stride(from: -600 + 80,
                    to: -600 + 80 + 160 * 5,
                    by: 160) {
Breaking that down:
-
The argument for the
fromparameter is . We start the expression with because that is the bottom edge of the poster. We add because that is half the height of the circle, and circles are anchored at their centre point. -
The argument for the
toparameter is . We start with because that is the centre of the first circle in the column. We add because that is the height of five circles. -
The argument for the
byparameter is because that is the height of a circle.
All of this makes the loop create the following sequence of numbers:
We use these numbers to control the position of each circle vertically.
By placing this second loop inside the first loop, we can draw a grid of circles, one column at a time, using this code:
for i in stride(from: -400 + 80,
                to: -400 + 80 + 160 * 5,
                by: 160) {

    for j in stride(from: -600 + 80,
                    to: -600 + 80 + 160 * 5,
                    by: 160) {

        // Draw the circle
        turtle.drawEllipse(at: Point(x: i,
                                     y: j),
                           width: 160,
                           height: 160)
    }
}
All of that is illustrated here – be sure to watch this mini-video several times to really see what is happening – pay close attention to the values of i and j:
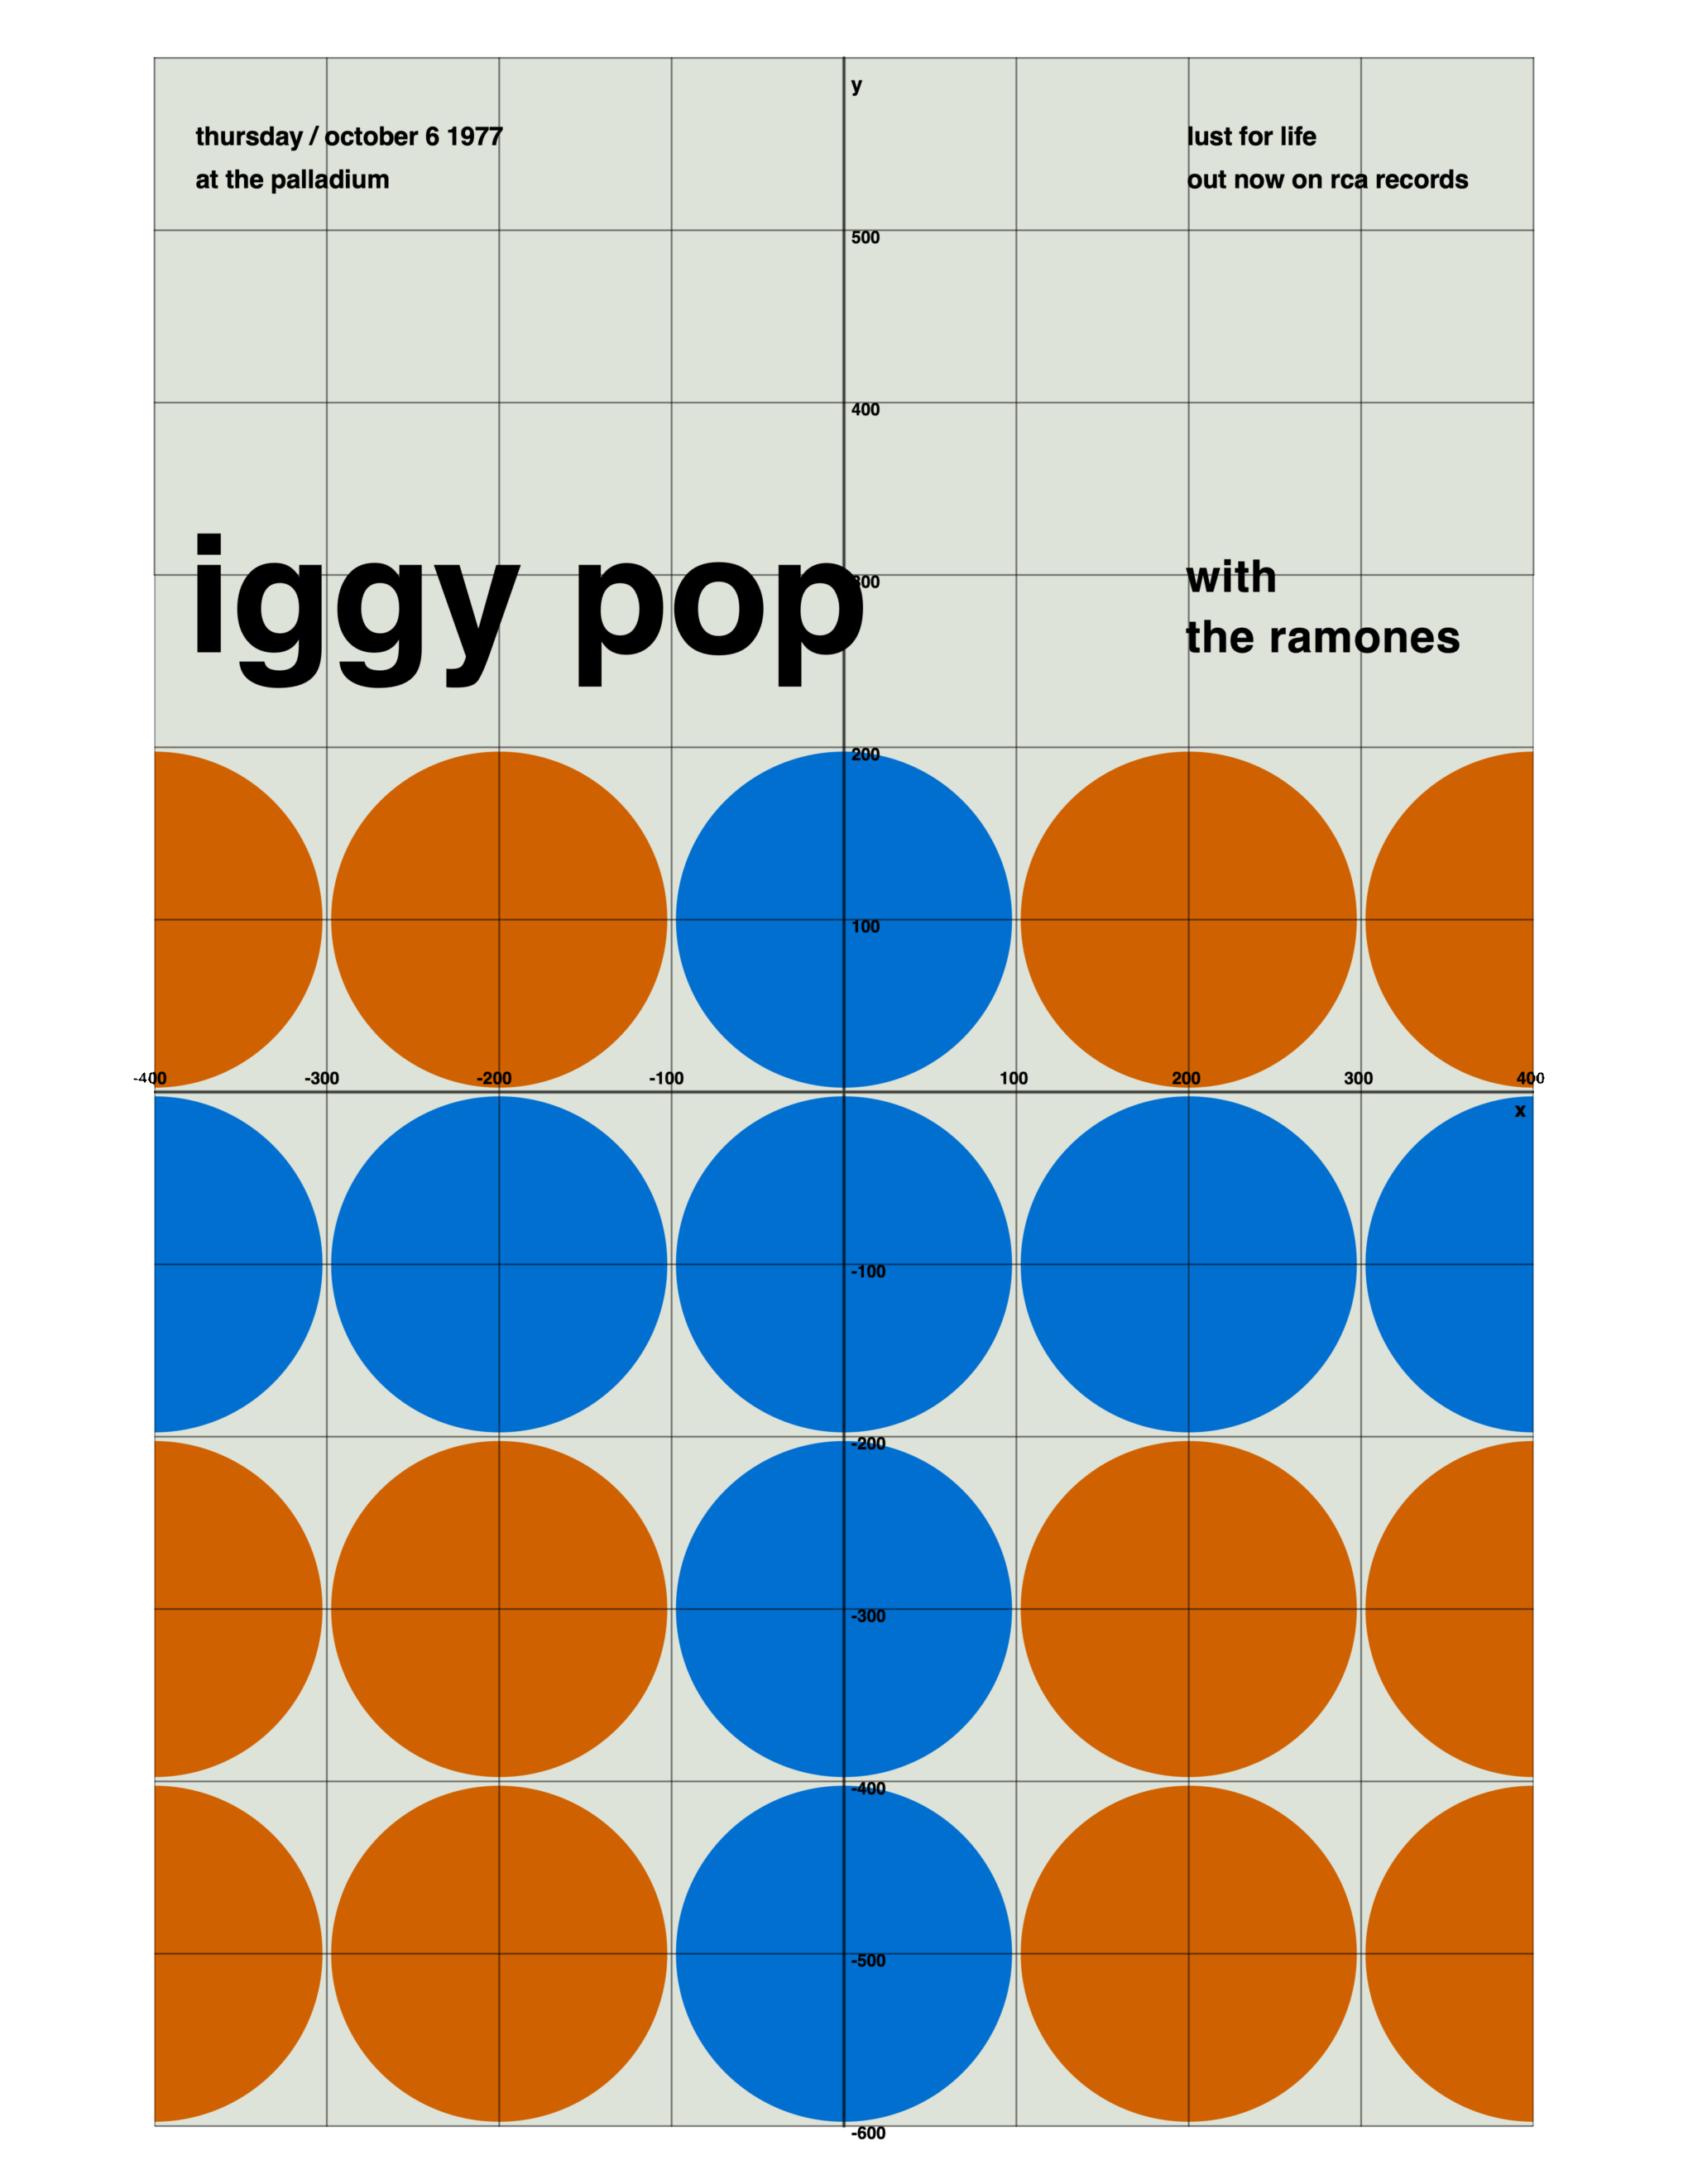
Exercise: Iggy Pop
Apply the same principles that you have reviewed above to build the following poster:

Here is the poster with a grid:
TIP
Use the planning sheet provided in class to analyse the poster in the same manner as was shown earlier in this tutorial.
It is worth noting that a circle is located on the by its centre-point.
Begin by analyzing the centre-point of each of these circles, and the distance between each centre-point, as you learned how to do in this lesson.