A “gig” is an occasion where a band or singer performs for an audience.
If you are a solo vocalist, or a member of a band, and you have a gig – you naturally want people to attend that performance.
A gig poster is used to draw the attention of people passing by in a heavily populated area in the hopes that they will choose to attend the performance.
As such, designs for a gig poster should draw the eye.
Mike Joyce is a graphic designer who has created original gig posters for well known performances made by bands and artists in the past.
For the next couple of weeks, by reproducing some of Mike Joyce’s posters, and then creating your own original gig poster, you will revisit and reinforce your understanding of these key programming concepts:
- sequence (order of statements)
- iteration (loops)
- abstraction (use of functions)
You will also learn about a new concept:
- selection (choosing a block of code to be run based upon a condition)
Making a Plan
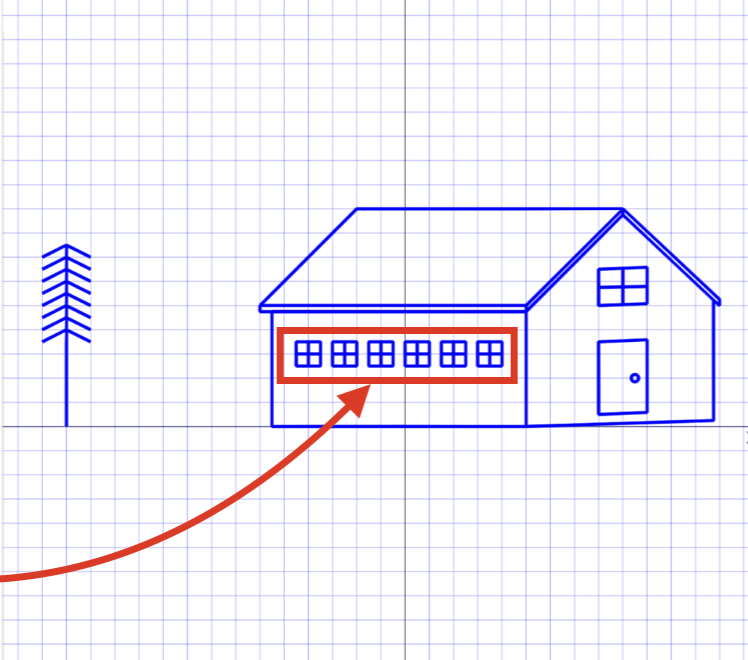
You have used loops in the past to render repeated elements of a drawing:
Consider the following gig poster:
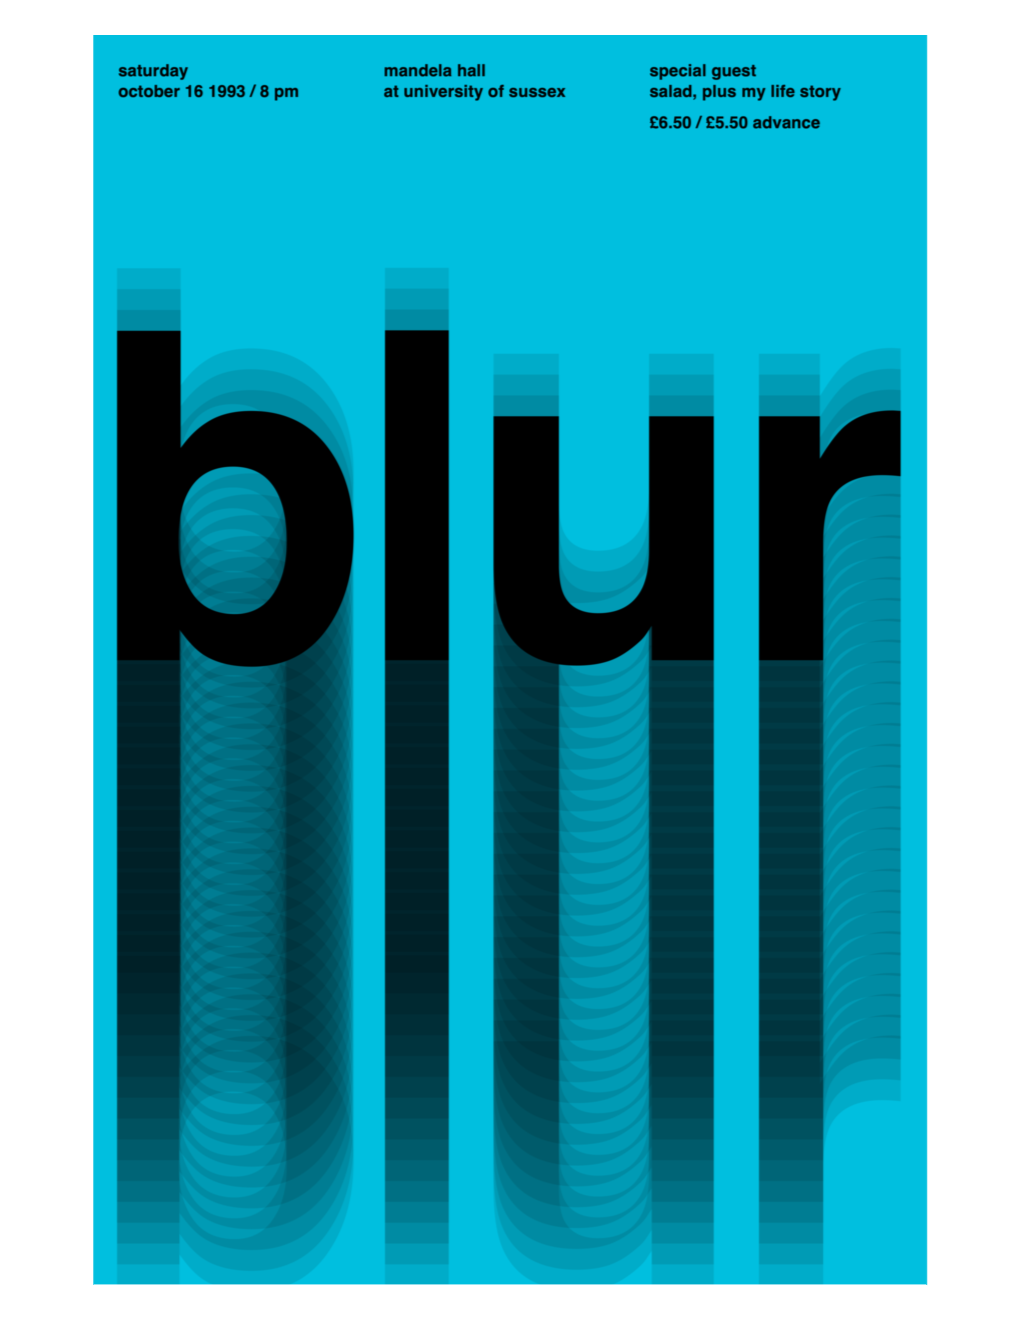
What repeated elements do you see in this poster?
It might be helpful to view this poster against a grid:
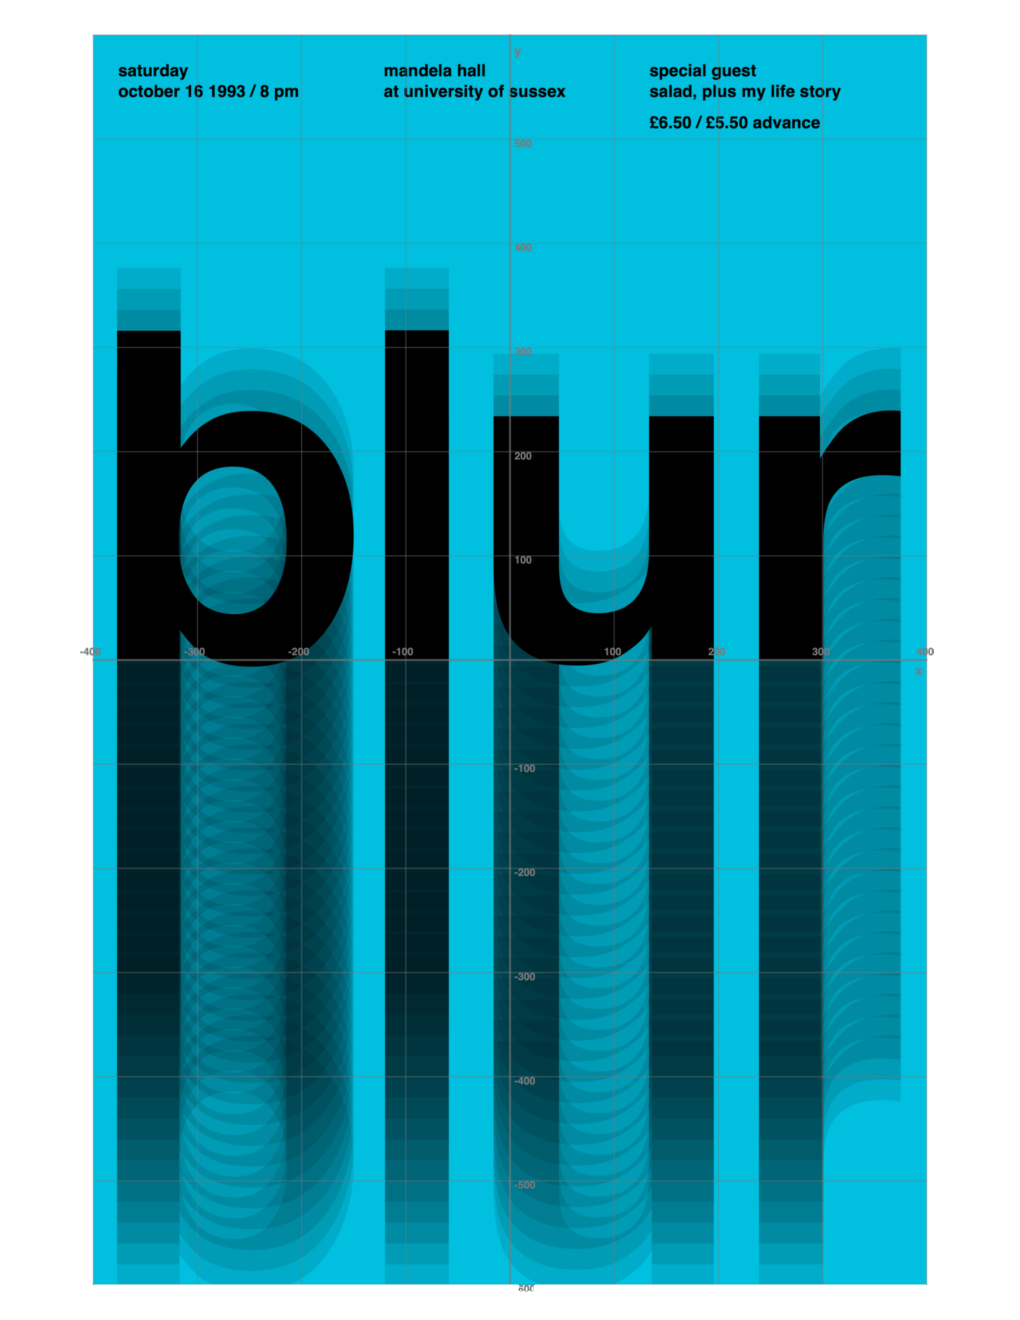
We can reproduce this poster by applying the concepts of sequence and iteration.
With your partner, mark up the planning sheet you have been provided with, and:
- number elements of the drawing to indicate what order they might be drawn in (sequence)
- identify where a loop might be used (iteration)
- consider the position of each repeated element
- look for a numerical pattern in the positioning of each element
TIP
When text is drawn, imagine a rectangular box around the text. To position text you specify the co-ordinates of the lower-left corner.
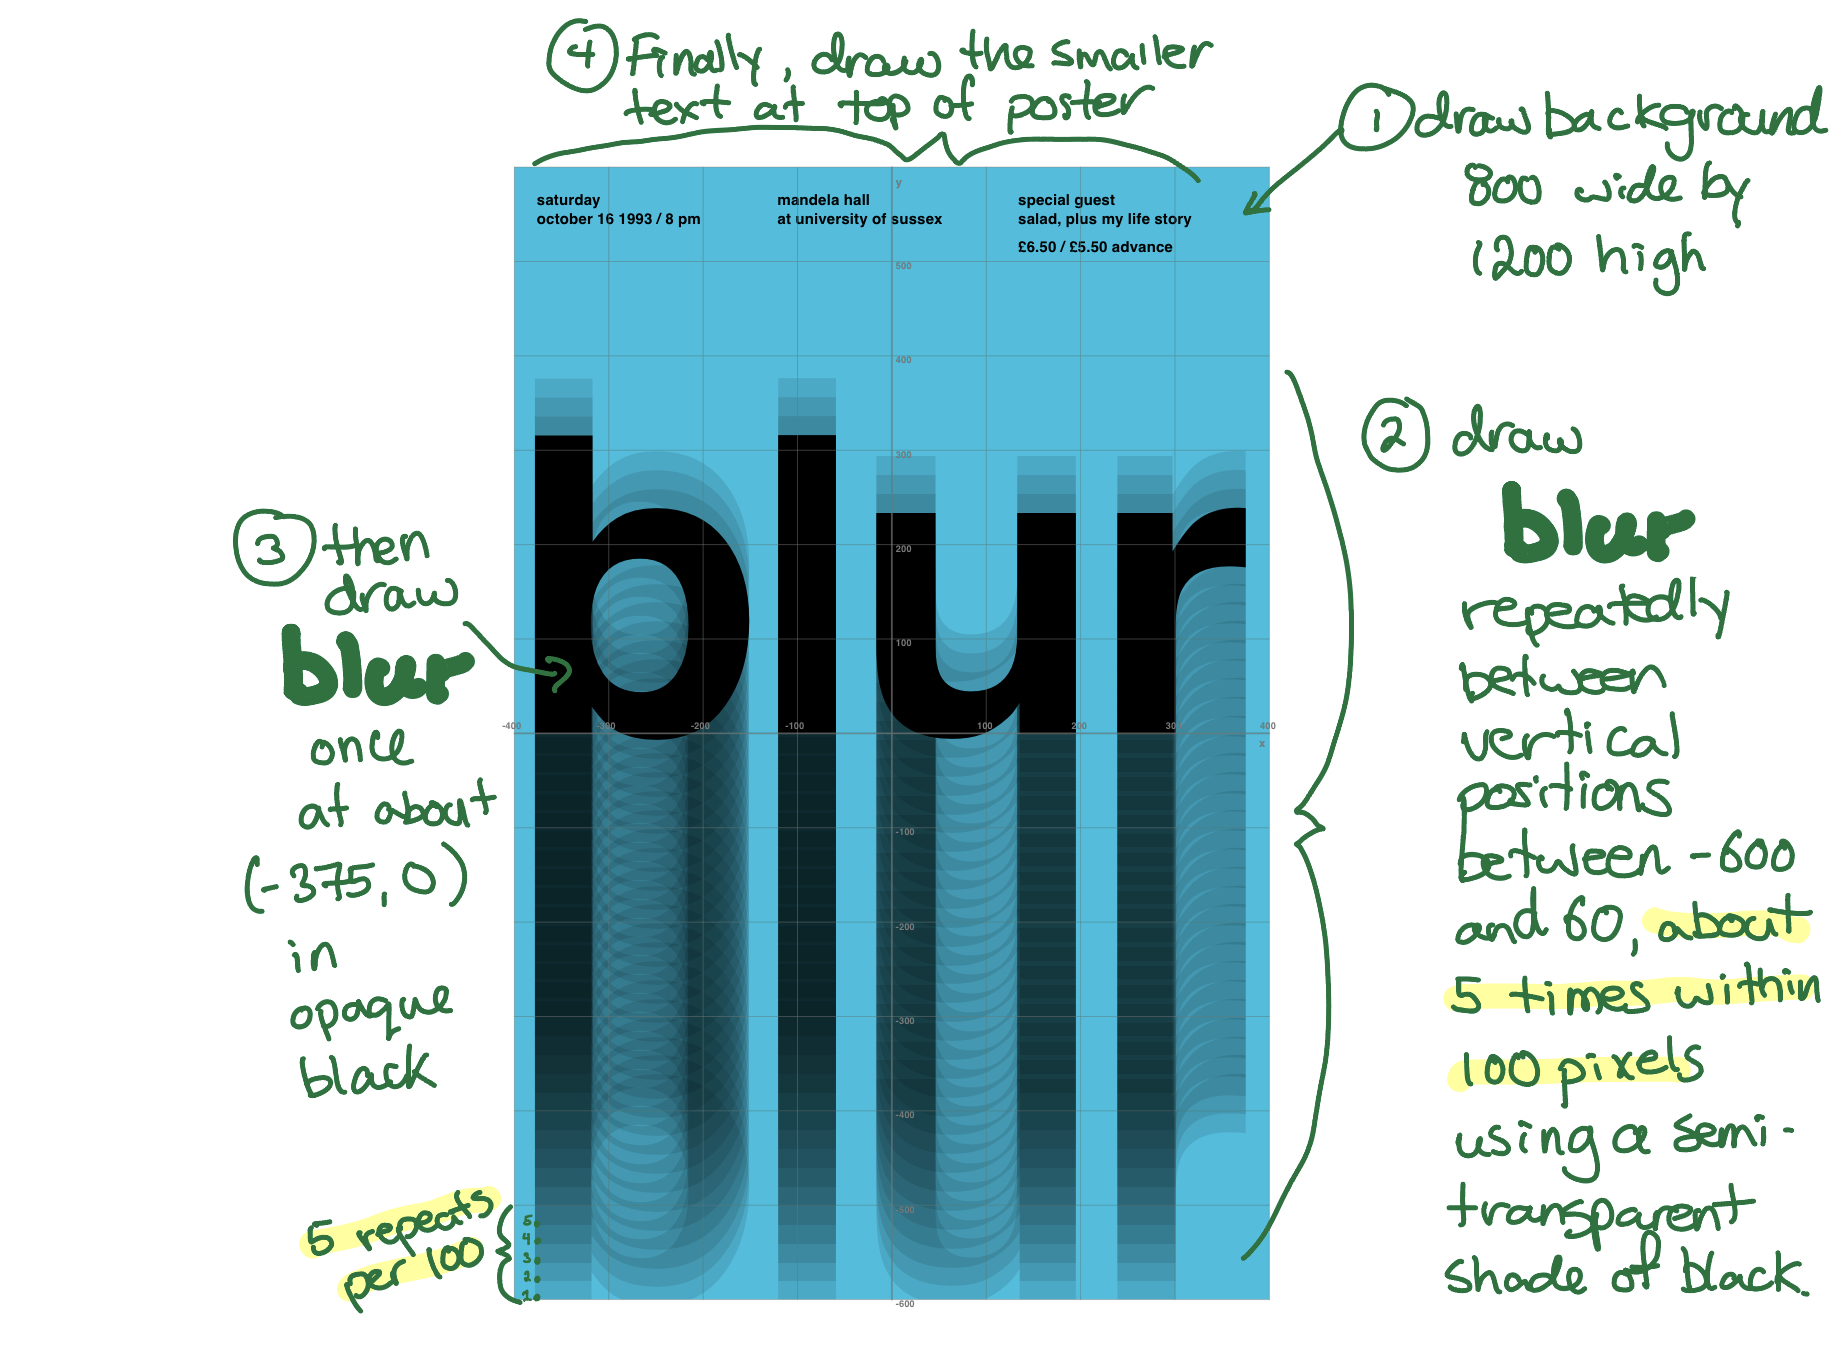
After some thought, you may have come up with something like this:
Let’s look at how to implement this now.
Implementation
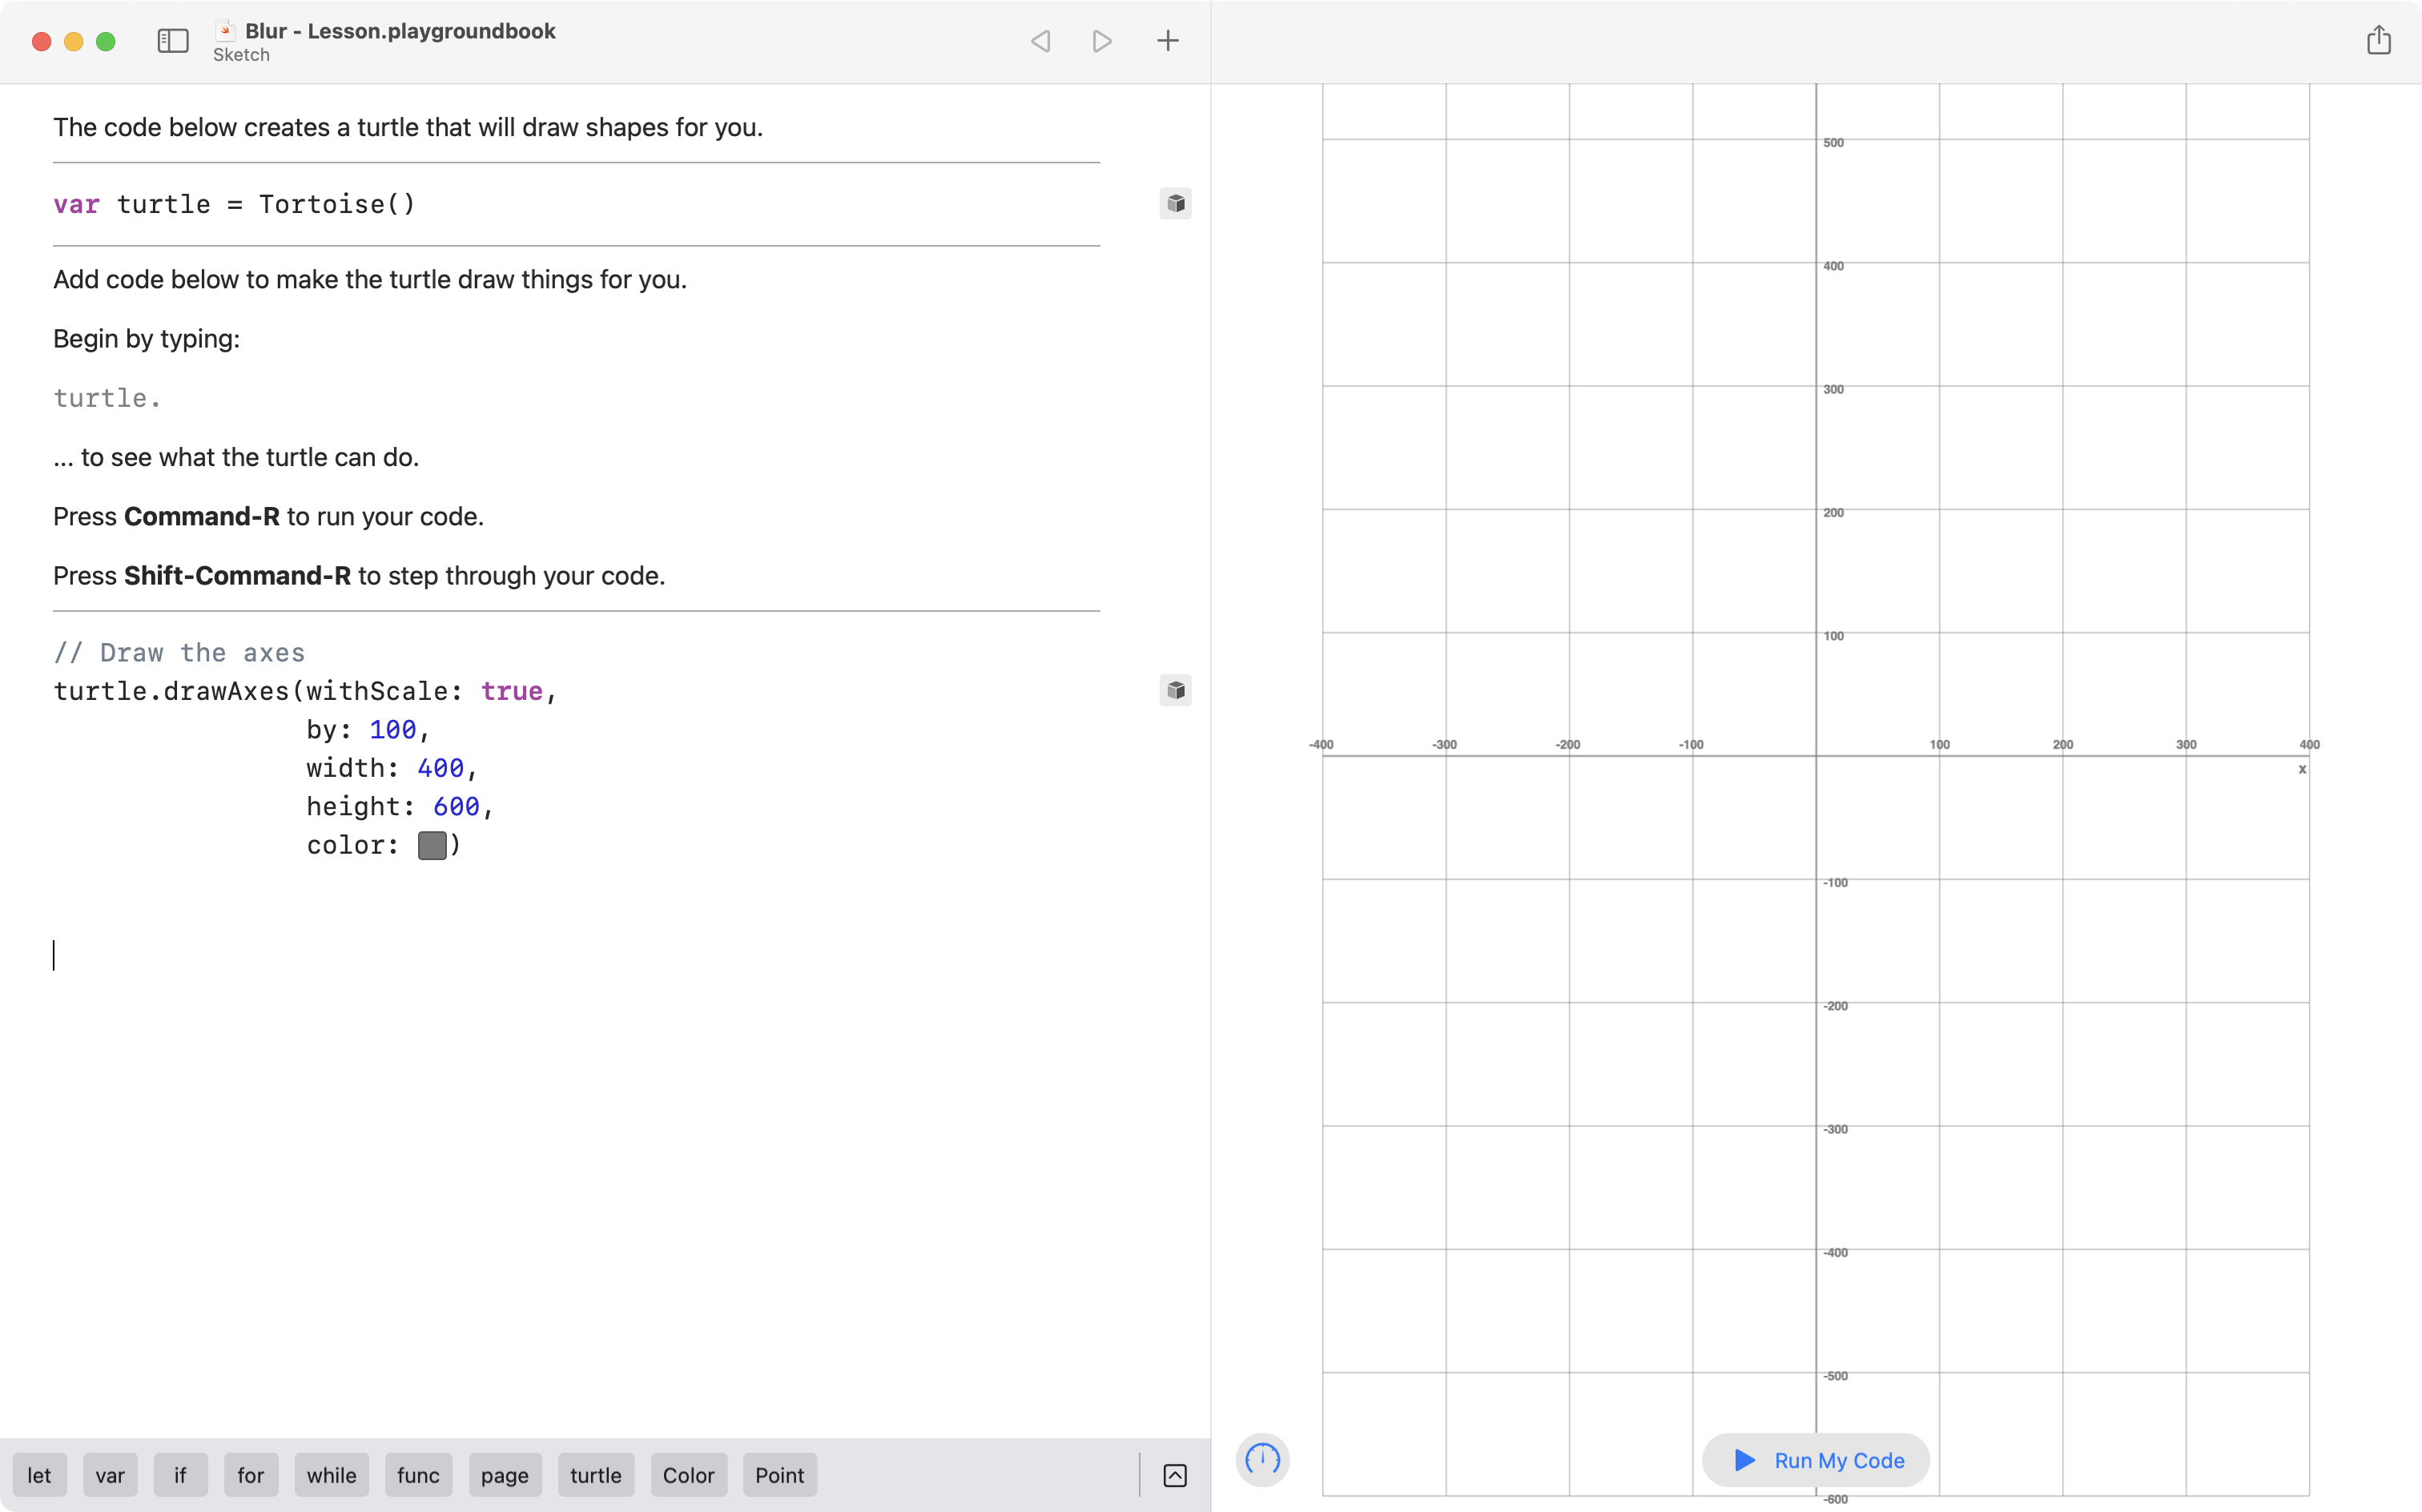
Add the axes
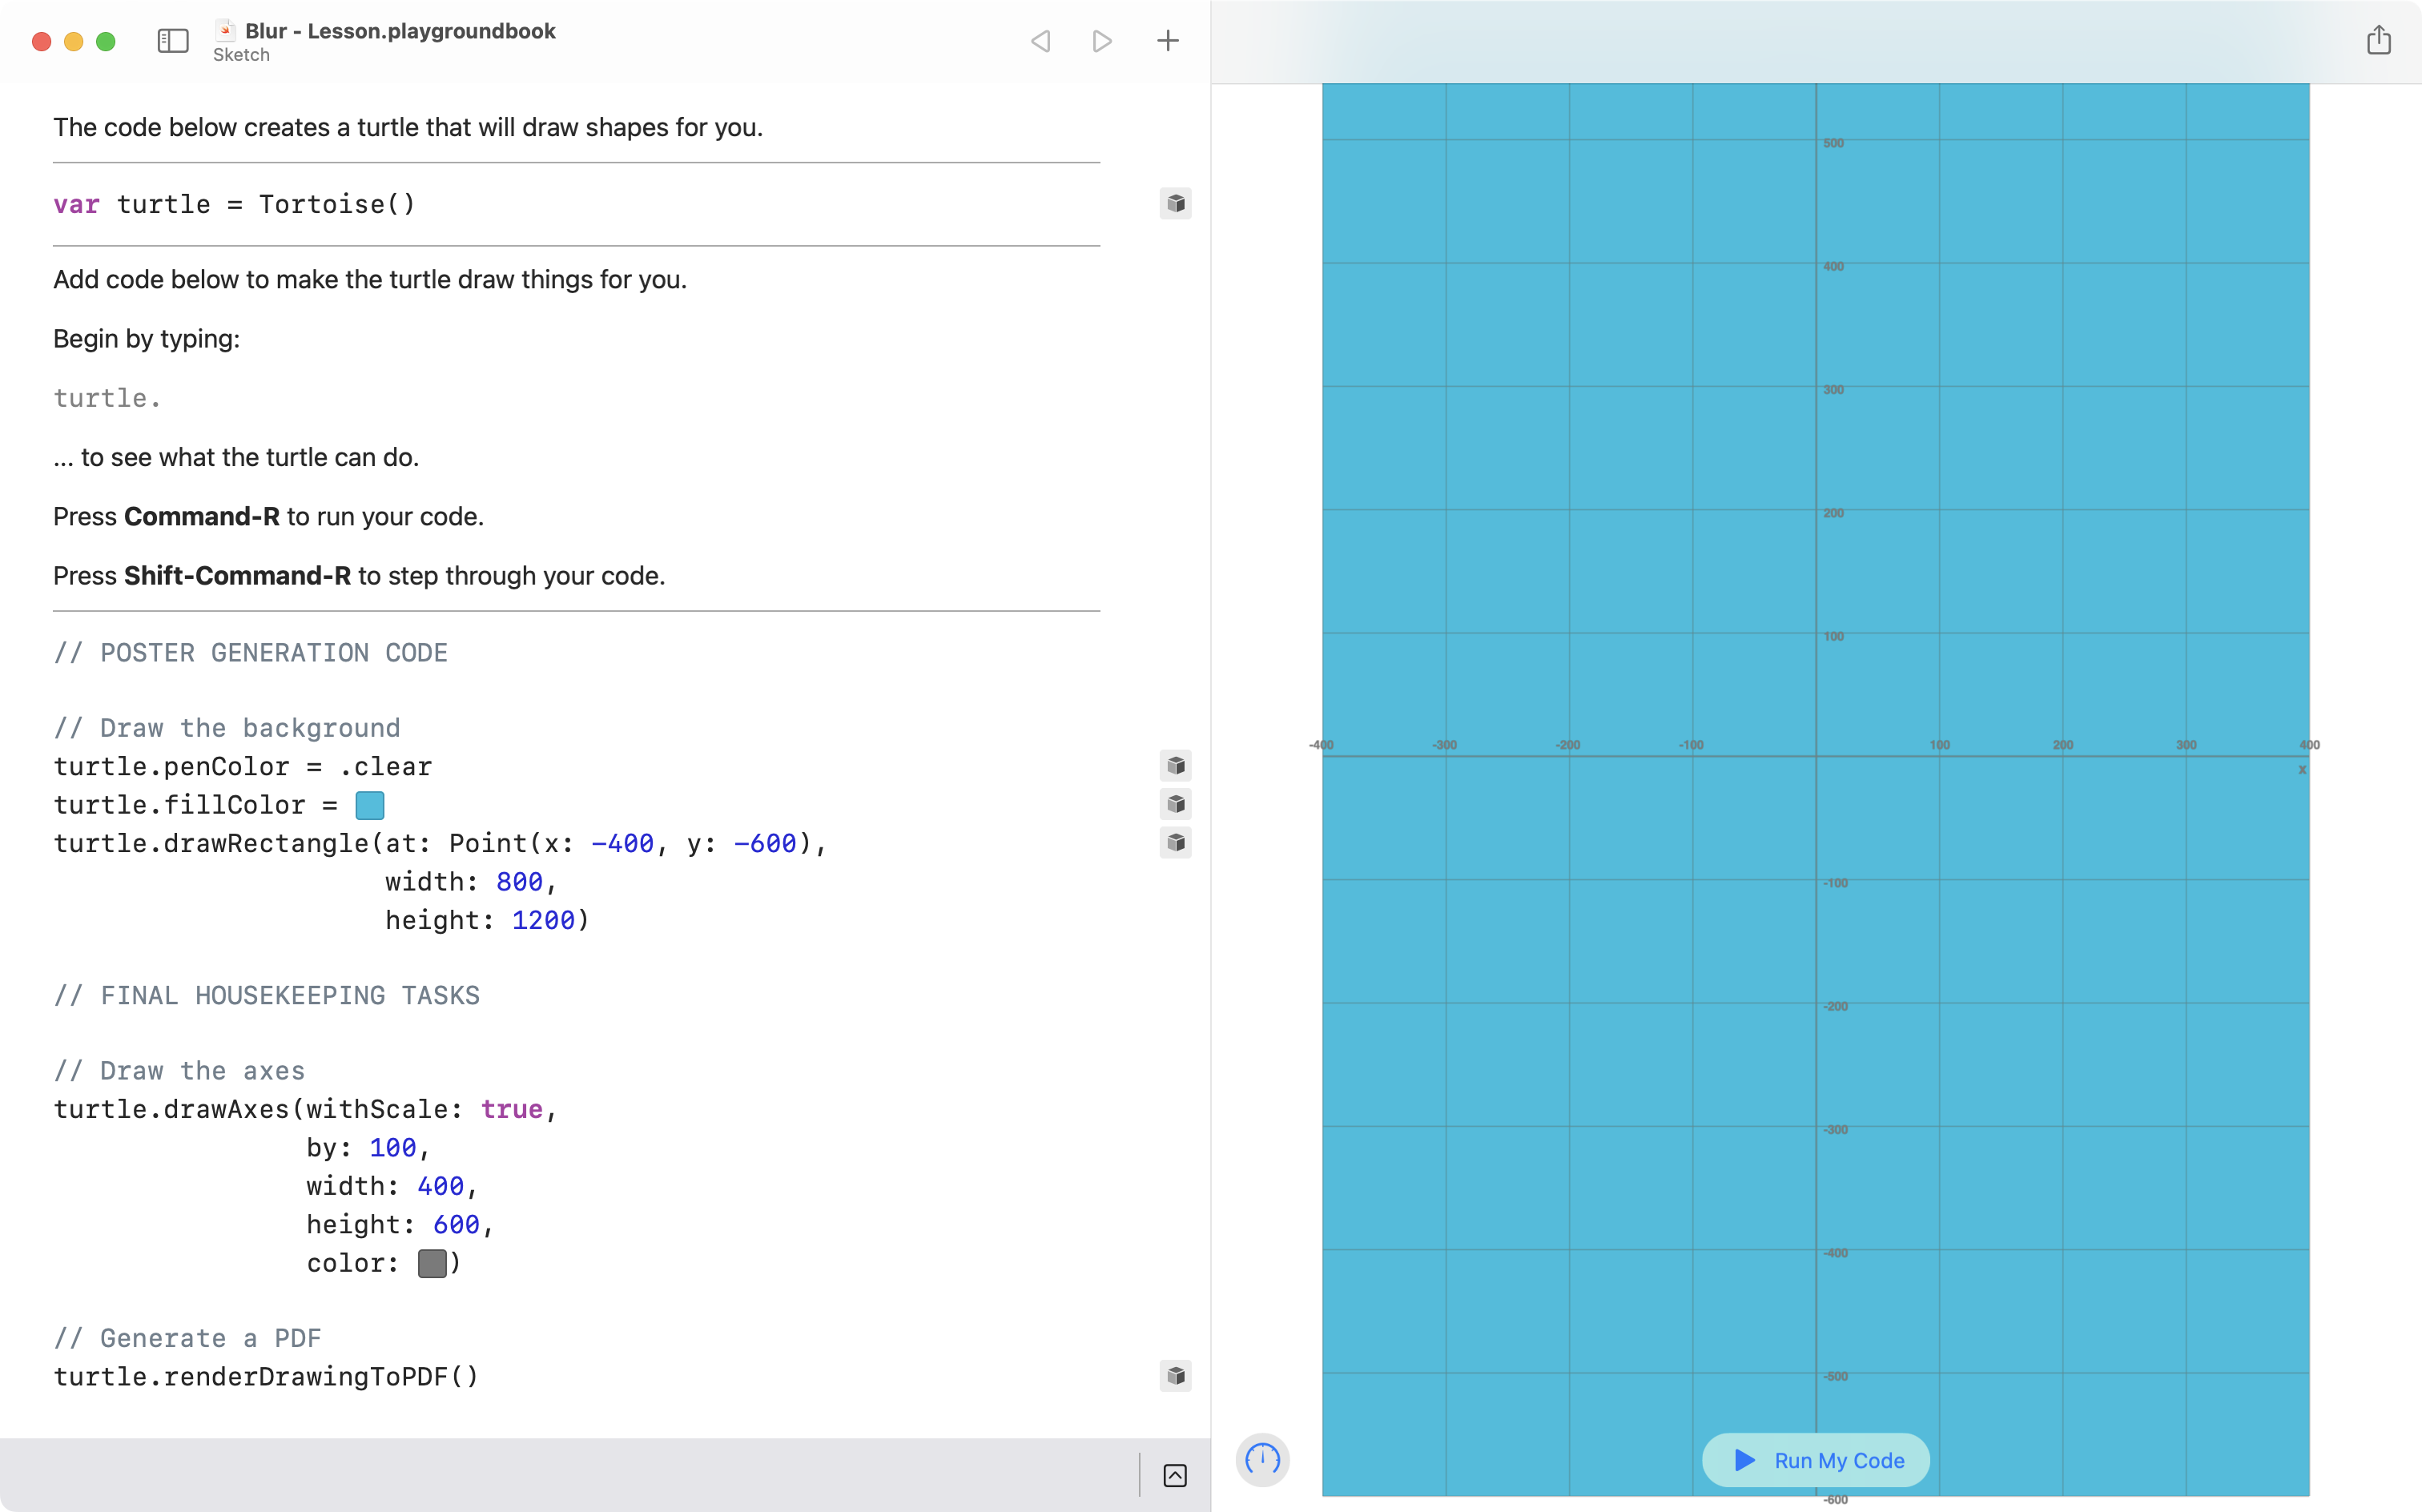
First, add the axes and the scale.
The first quadrant of every gig poster will be 400 pixels wide by 600 pixels high:
TIP
To create the color well (allowing for colors to be selected from a flyout menu) begin typing
#colorLiteral(.As you type the opening bracket,
(, the code will turn into a color well.
Generate PDF output
You may see that the grid does not completely fit within the height of your computer’s screen.
That is OK – you can also check what your program produces by generating a PDF file of the output.
Add this code to the end of your program:
// Generate a PDF
turtle.renderDrawingToPDF()
Here is how you can find the PDF after running your program:
TIP
Once you have found the PDF file, keep it open. When you re-run your code in Playgrounds, and then return to the PDF file, it’s contents will be updated.
Draw the background
Next, draw the background.
The drawAxes command, by default, anchors rectangles from their lower left hand corner.
So, to draw the background – identified in our plan as 800 pixels wide by 1200 pixels high – add the following code to the end of your program, anchoring the rectangle at :
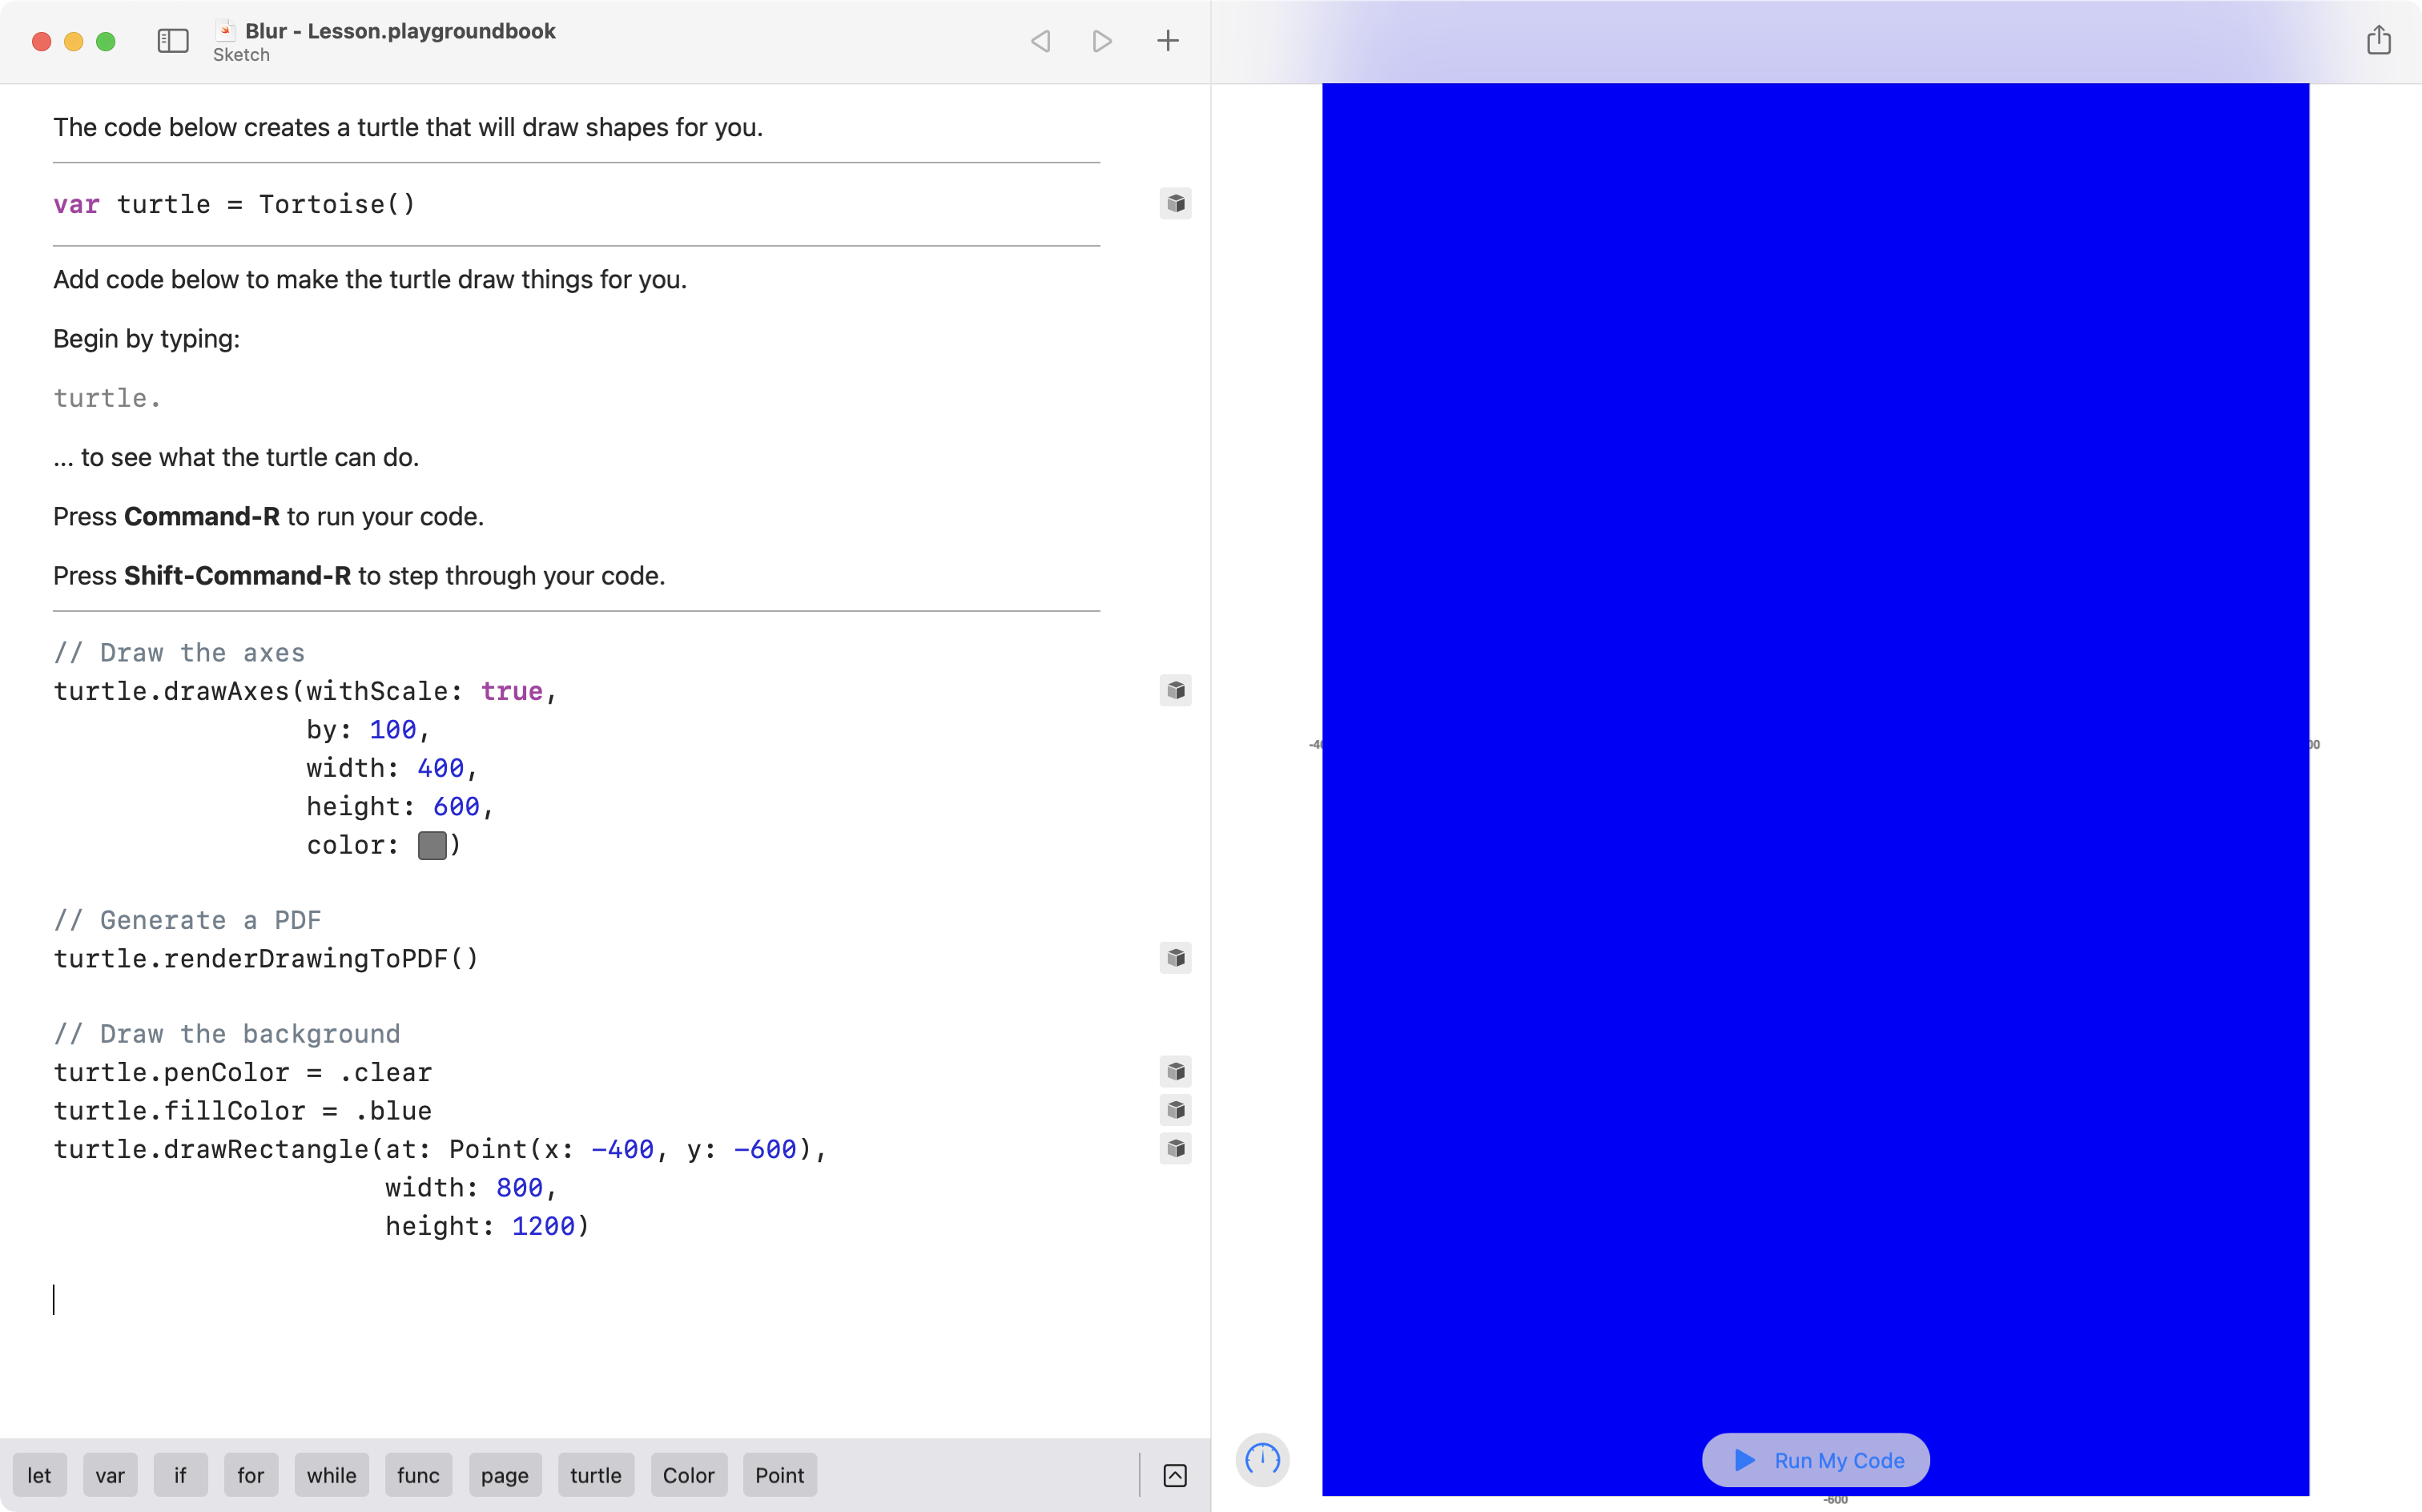
Three problems surface:
- The axes are no longer visible.
- The shade of blue is incorrecct.
- The PDF output does not match the output seen in Playgrounds.
Let’s fix these three small problems now.
1. Show the axes
The axes are not visible because the sequence of the code is currently incorrect.
The axes are drawn, and then the background.
So, the blue rectangle of the background covers up the axes.
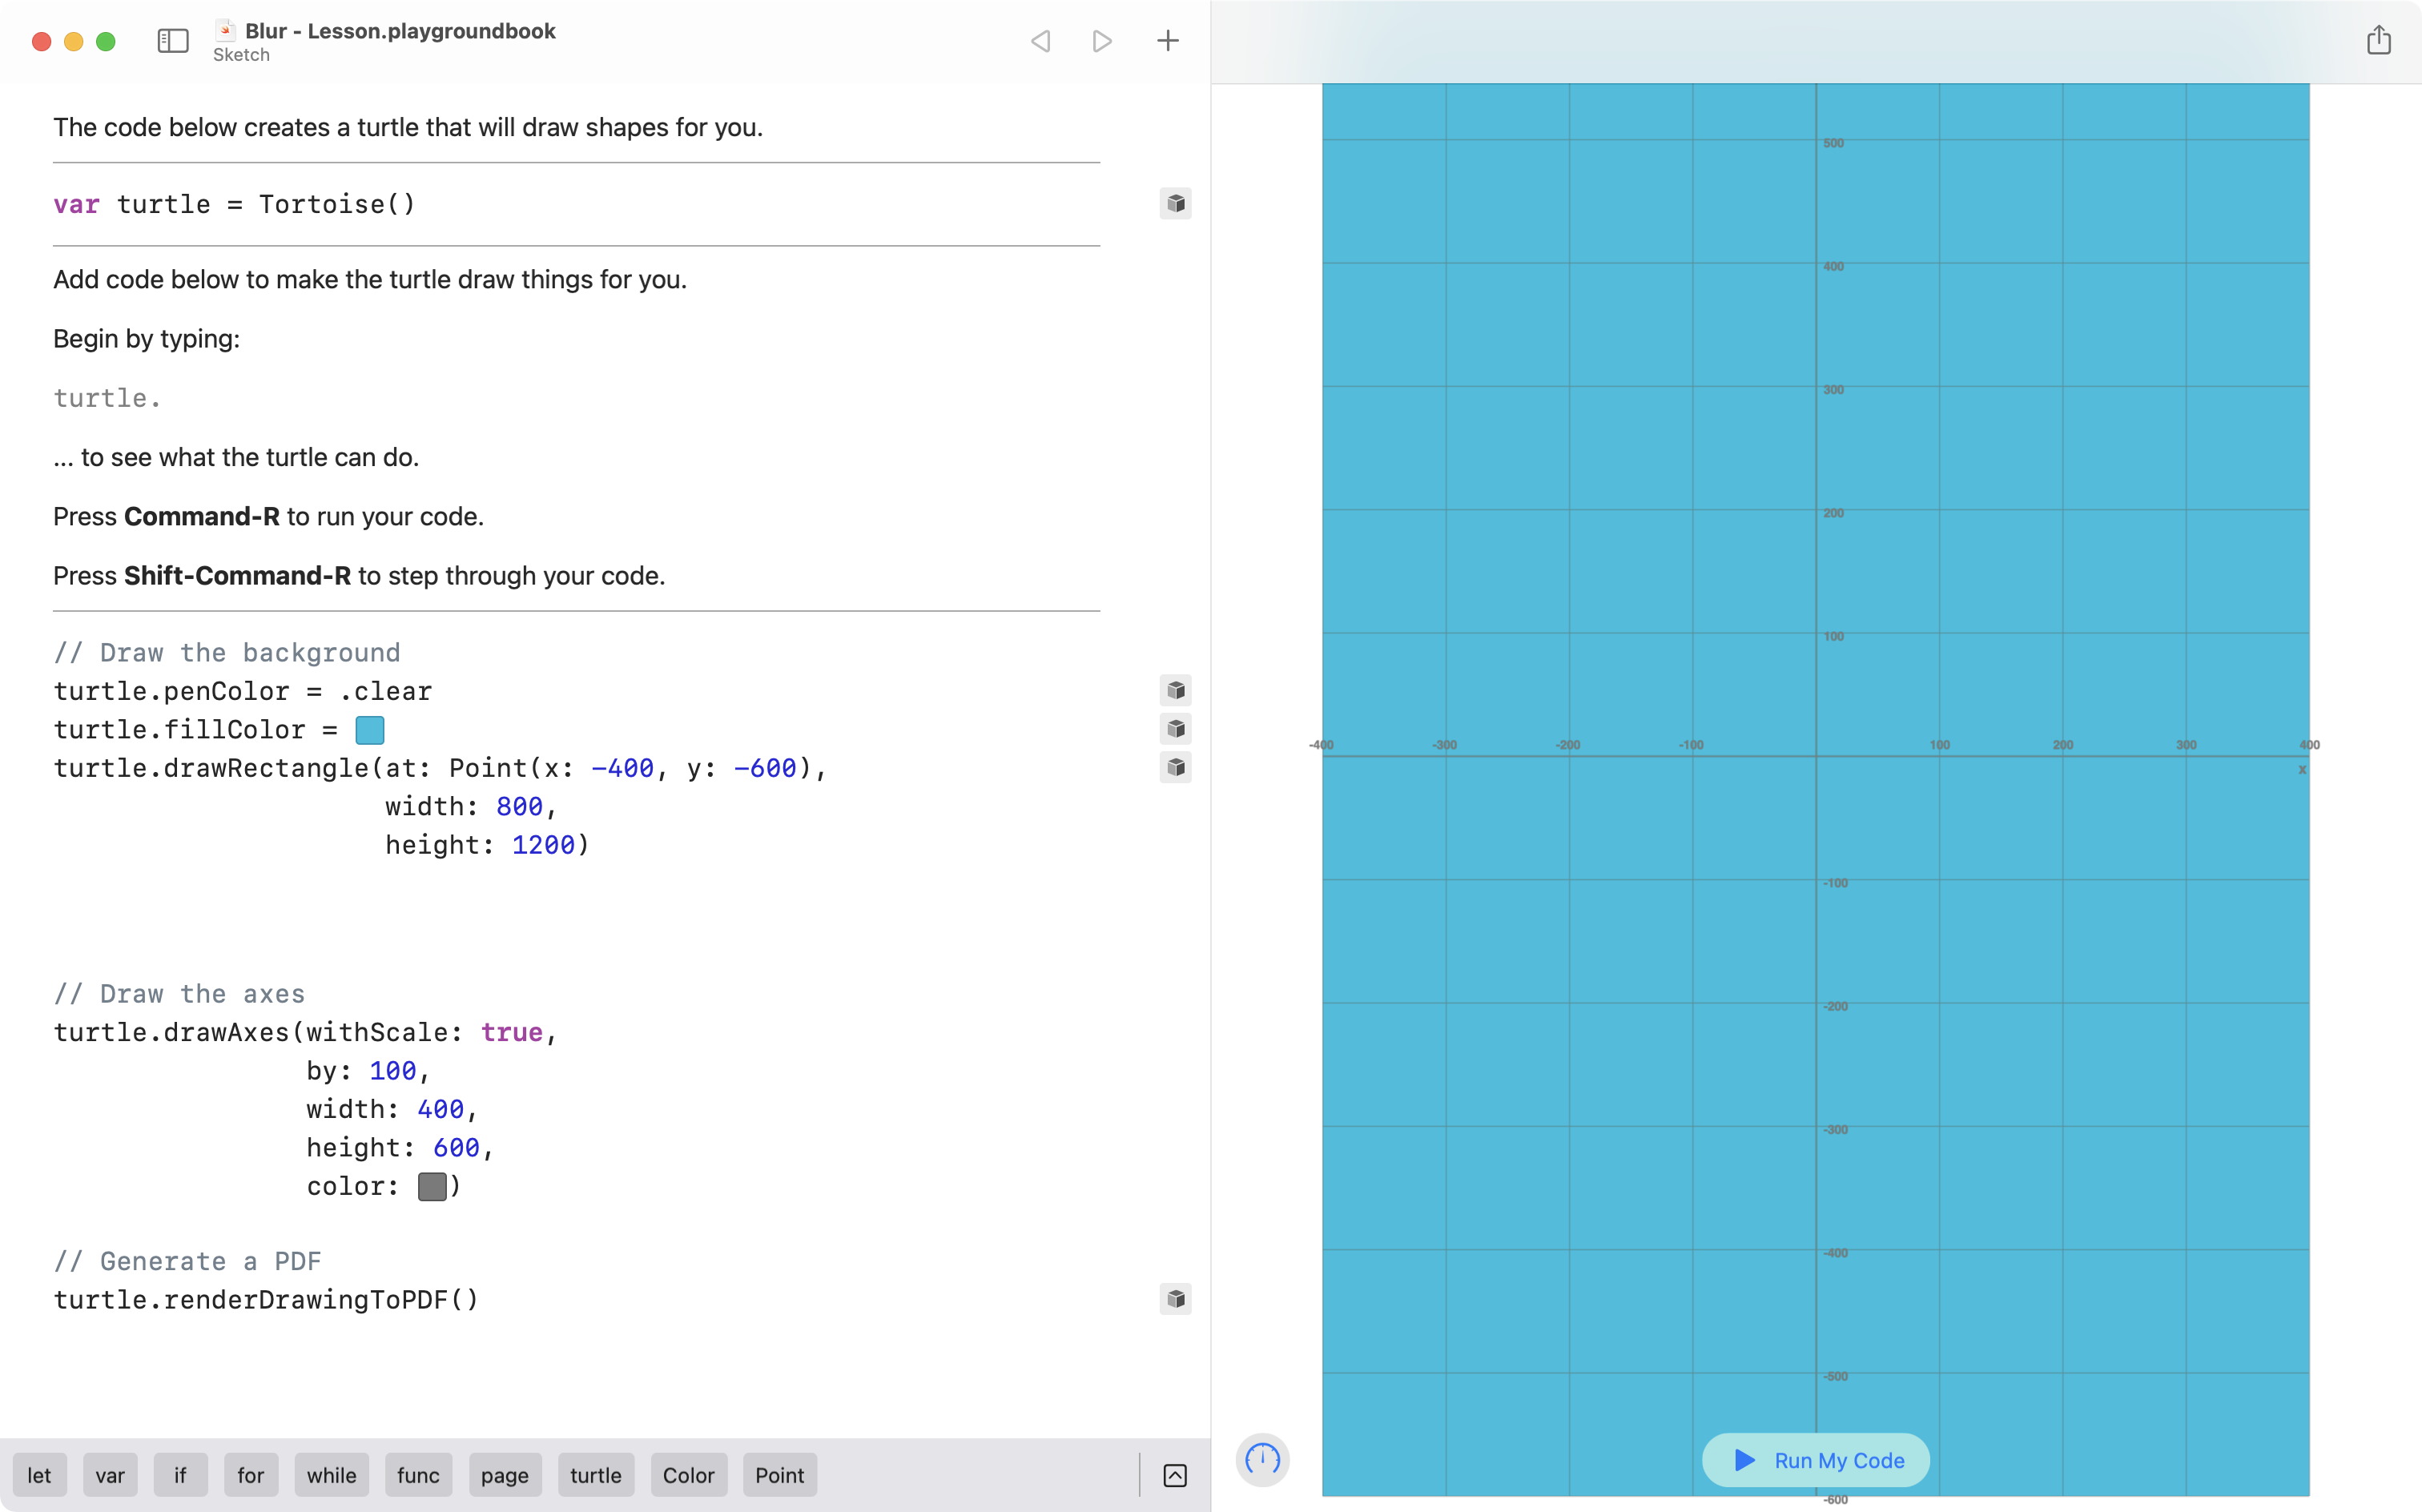
Instead, we should draw the rectangle for the background, then draw the axes.
Make good use of keyboard shortcuts as you change the sequence of the code:
Now the axes are visible.
2. Adjust the color
Using the color well and eyedropper tool, we can sample the correct color from the example given in this tutorial.
Arrange your Playgrounds window and this web page side by side, then sample the color like this:
Now the shade of blue is correct.
3. Ensure PDF output matches Playgrounds output
At this point, if we arrange the PDF (at left) next to the output from our code in Playgrounds (at right) the output does not match:
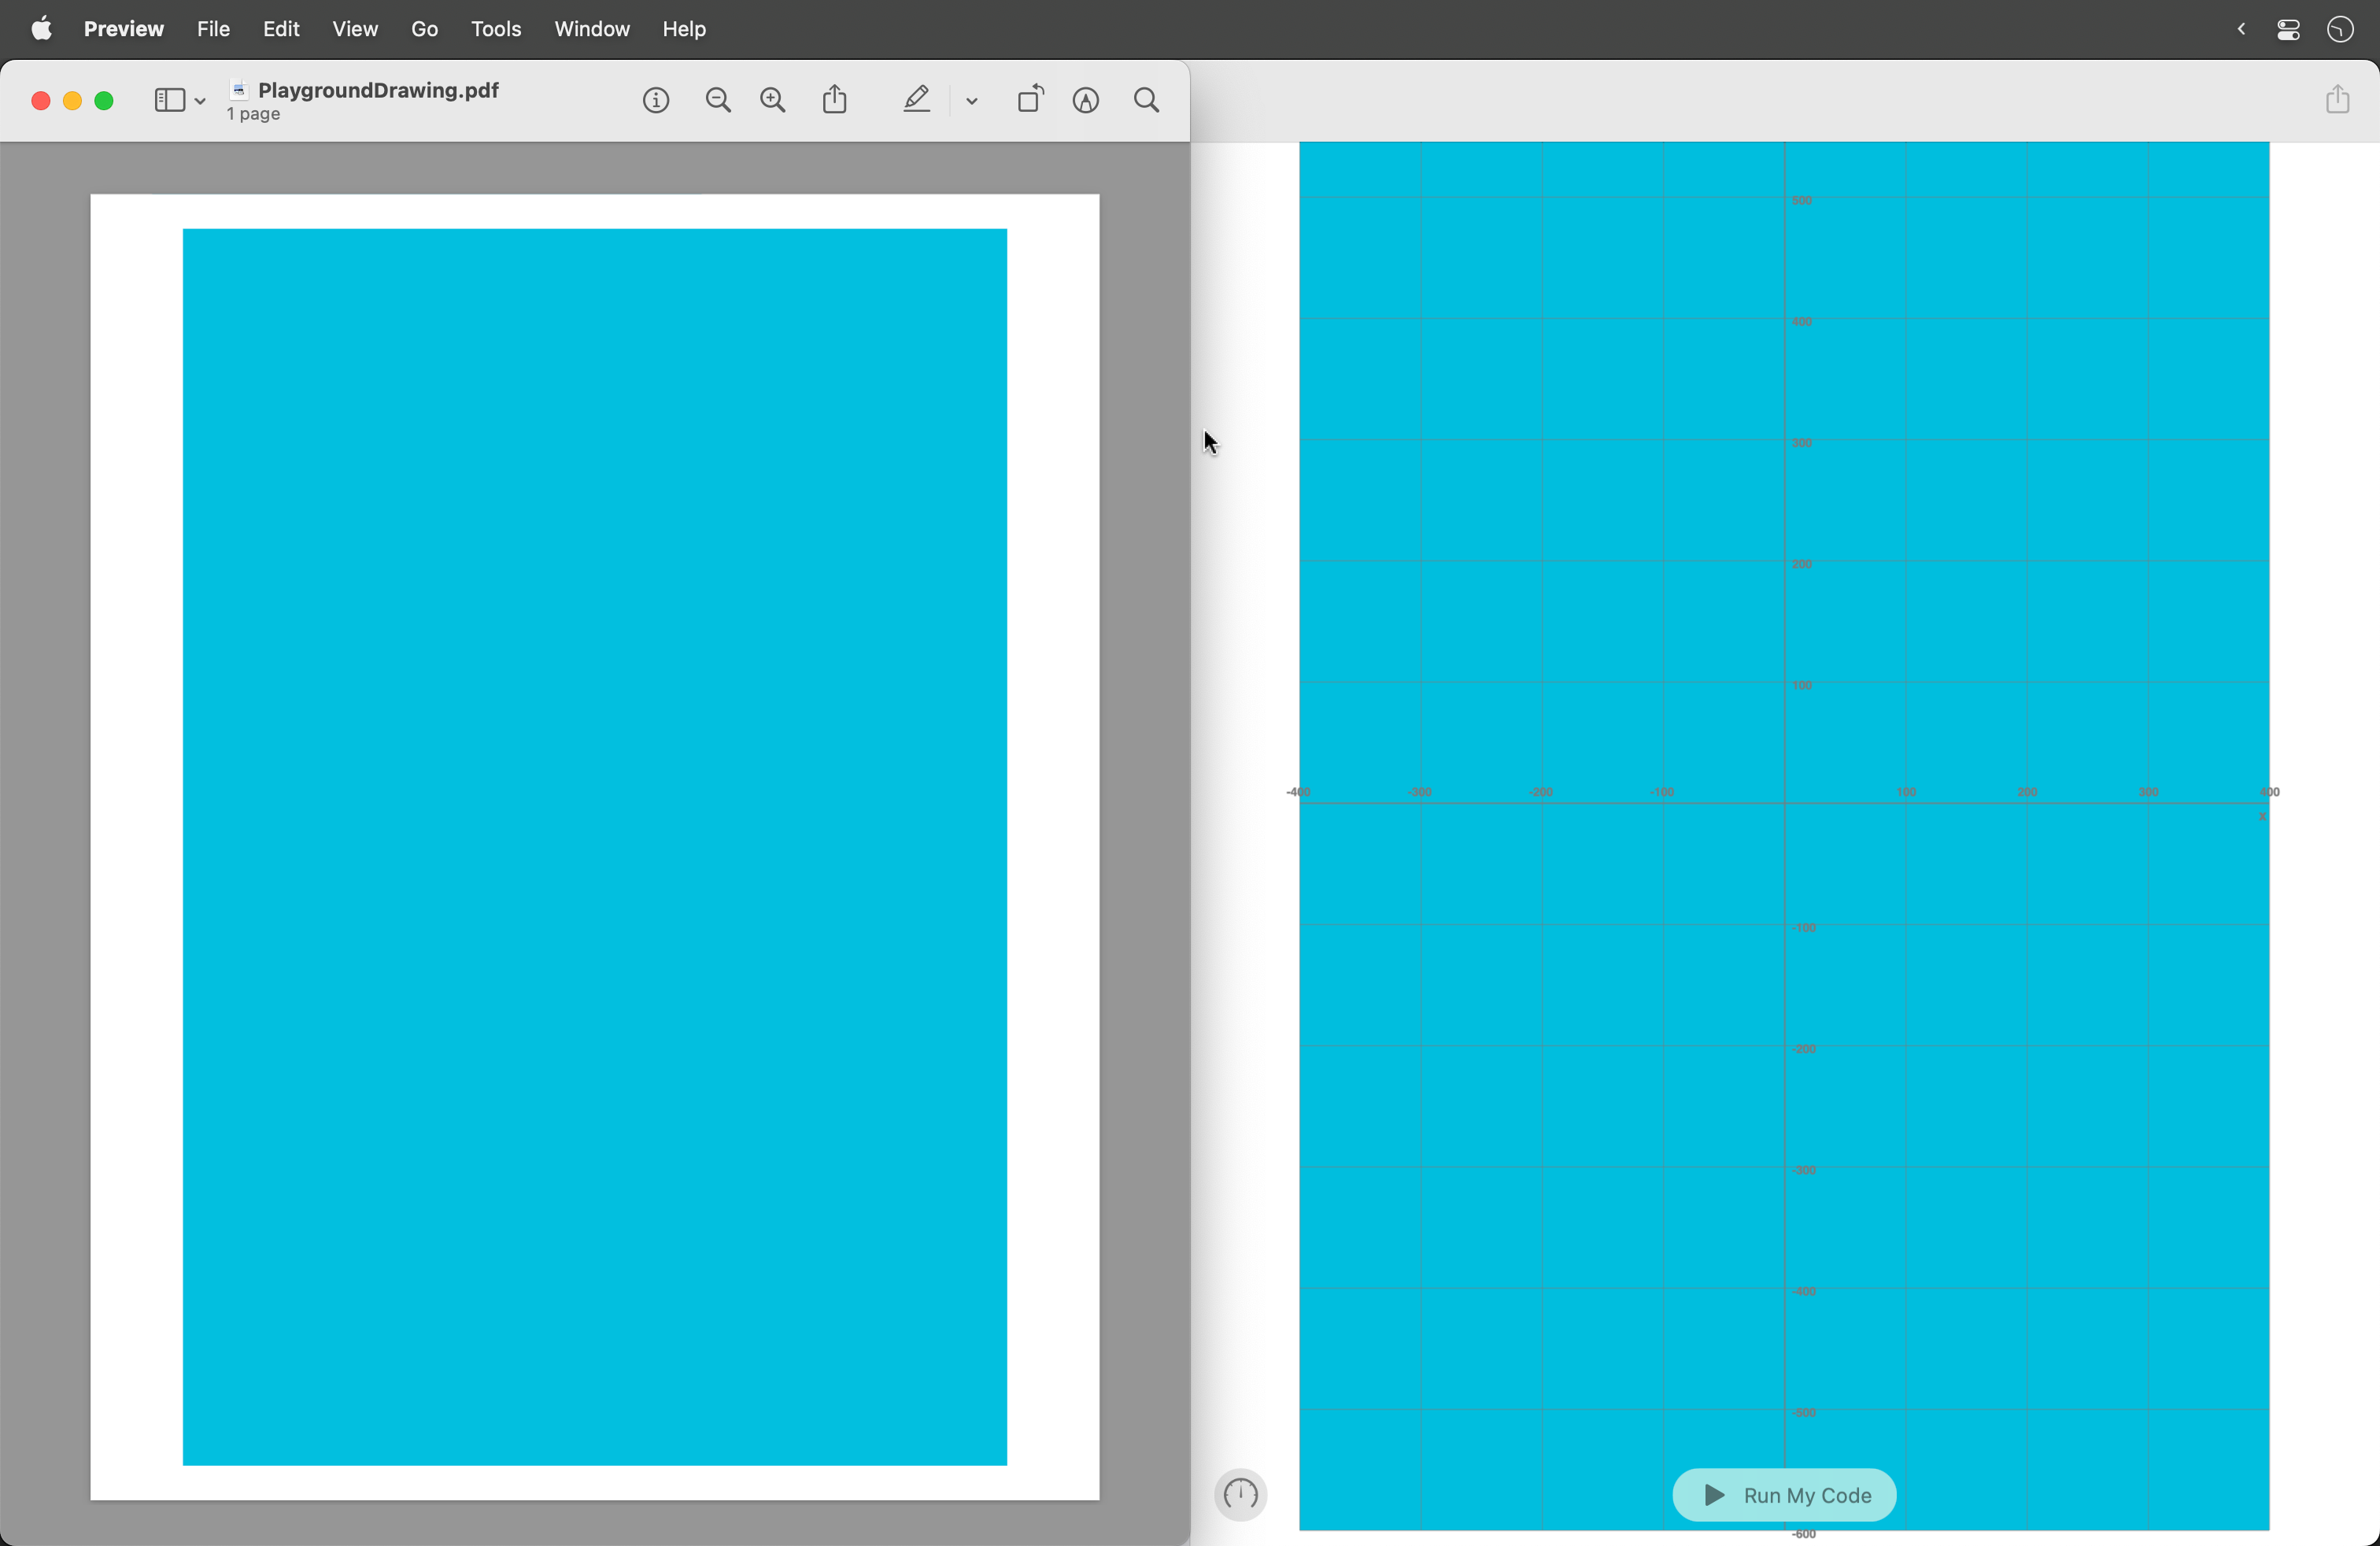
To fix this, again we must consider the sequence of our code.
As a general rule, ensure that the command:
// Generate a PDF
turtle.renderDrawingToPDF()
… is the final command in the playground’s code.
Right above that command, draw the axes:
And above that, have all the code that draws the poster.
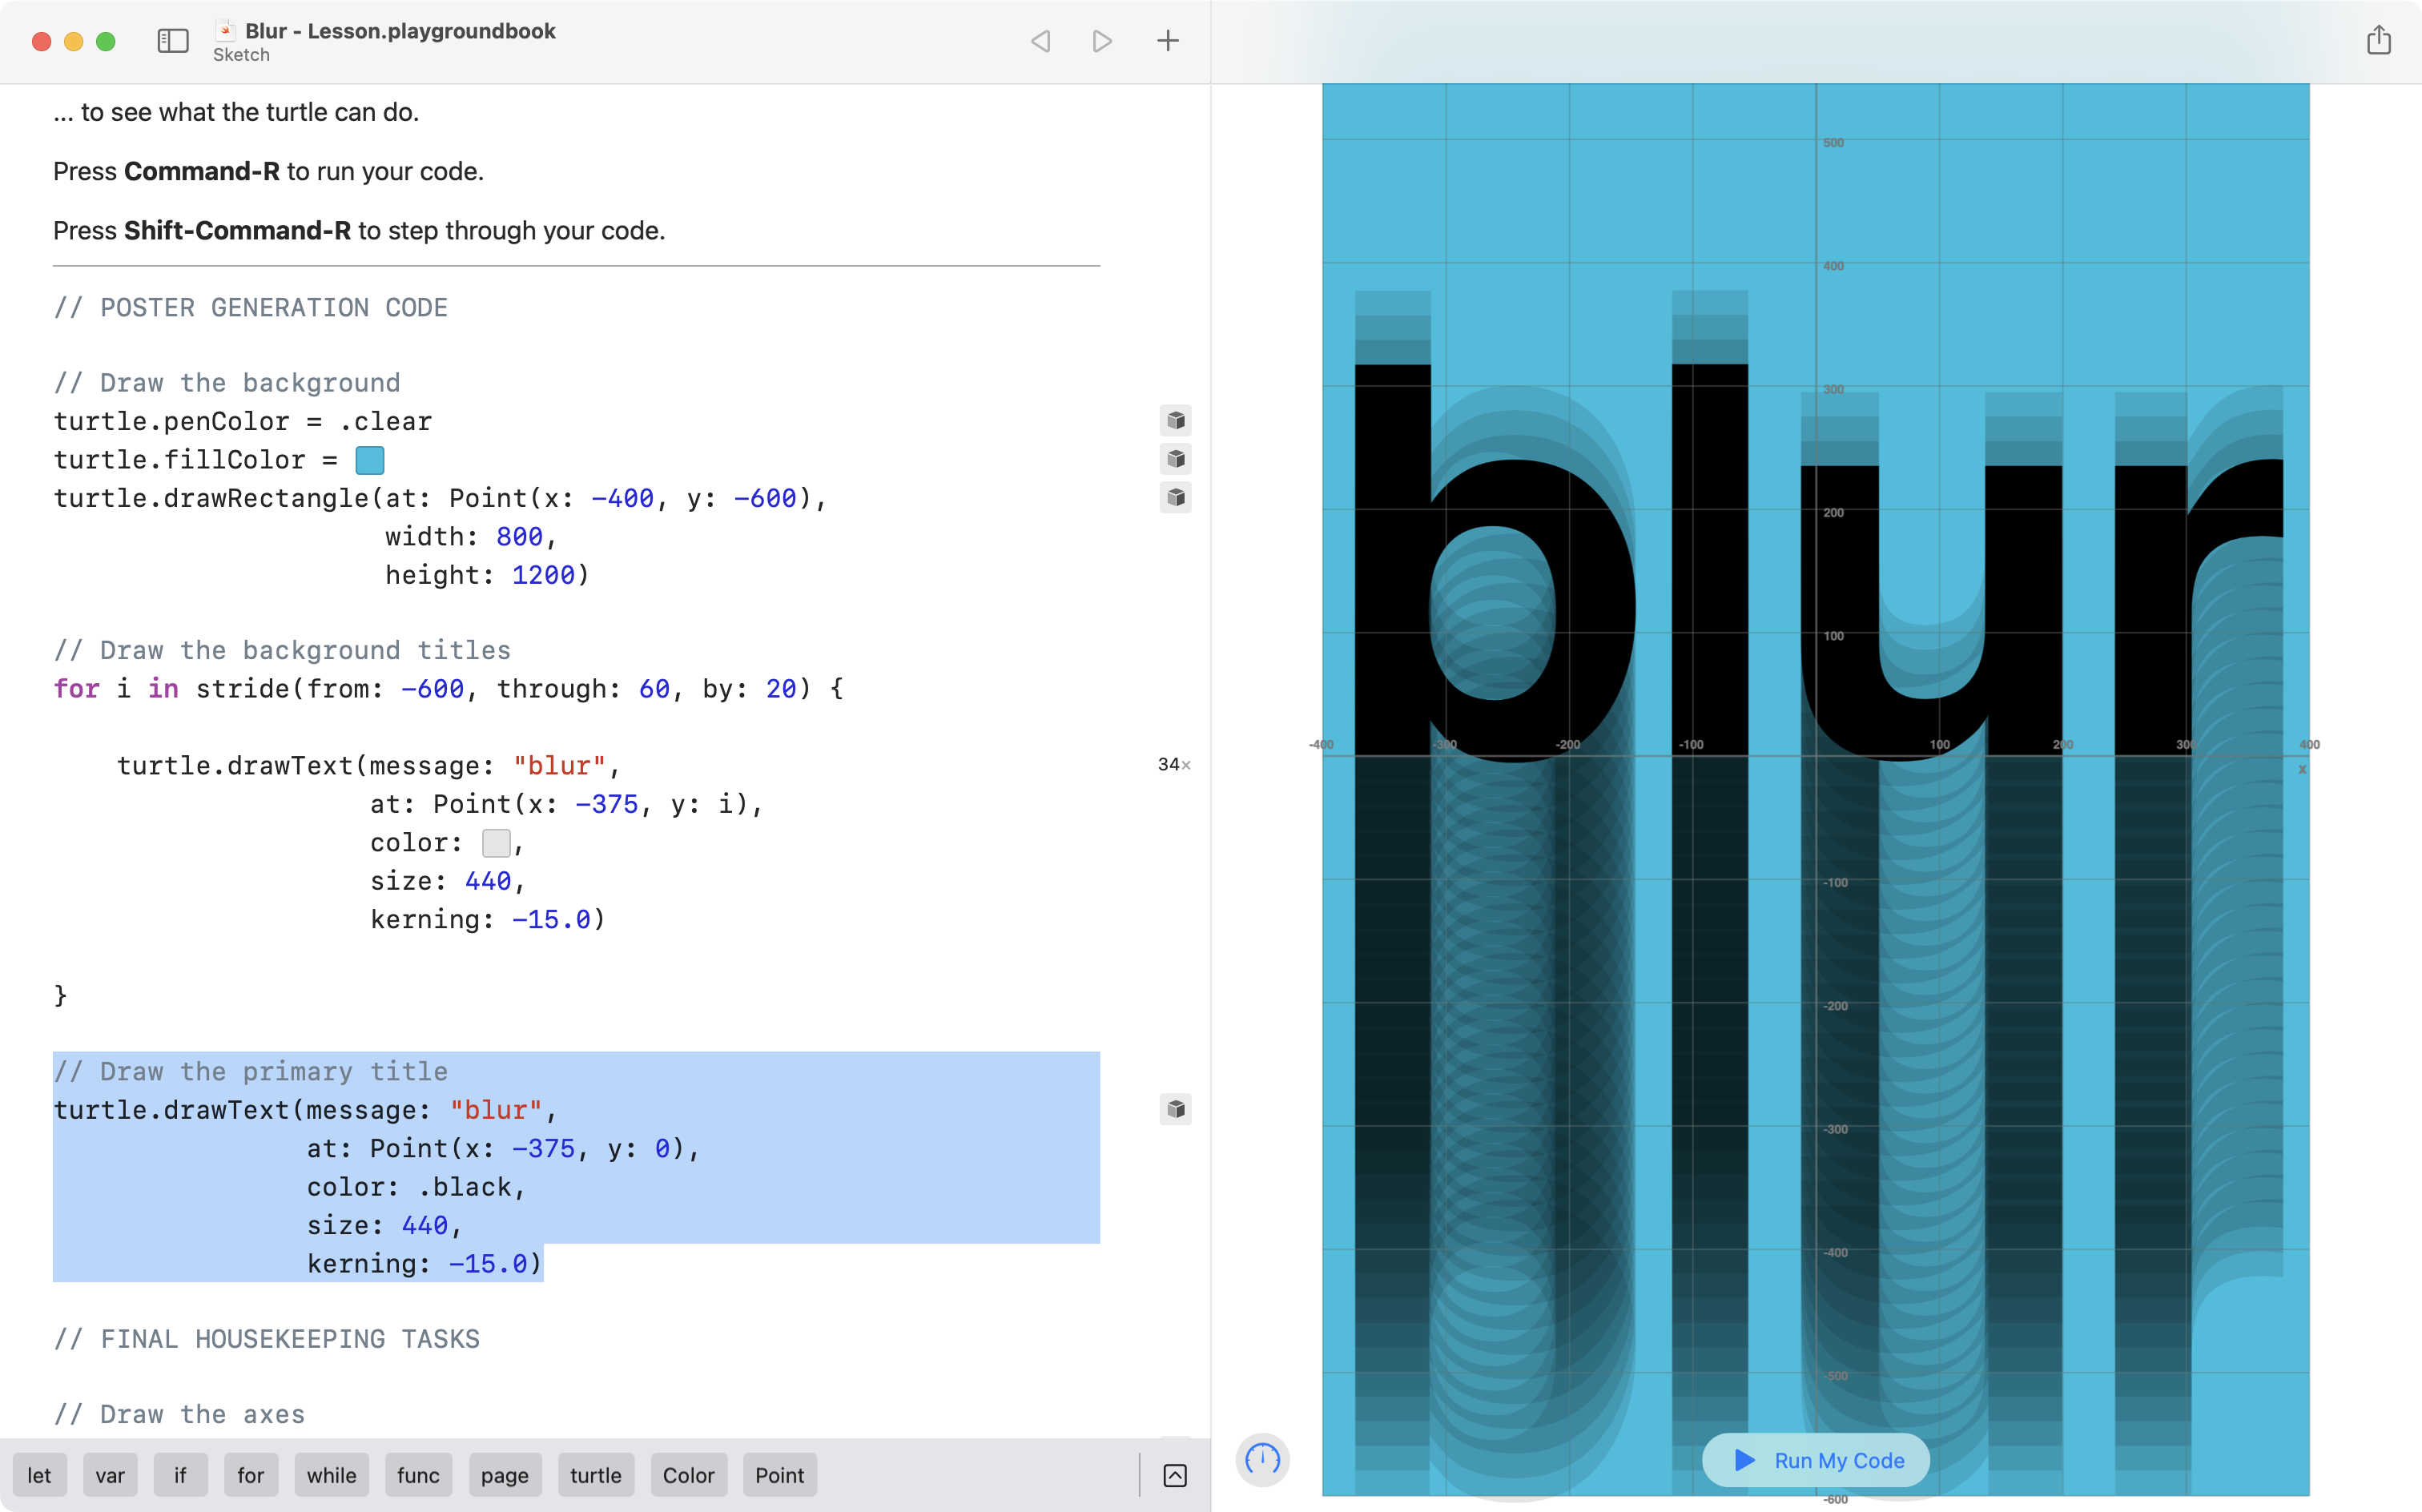
It can be helpful to separate these sections with clear comments, shown here using UPPERCASE letters:
Draw the band name repeatedly
According to the plan, the second step is to draw the name of the band, blur, repeatedly:
Recall that the lower-left corner of the the text is the anchor point.
In the plan, we see that anchor points range between -600 and 60. Note the annotations in red:
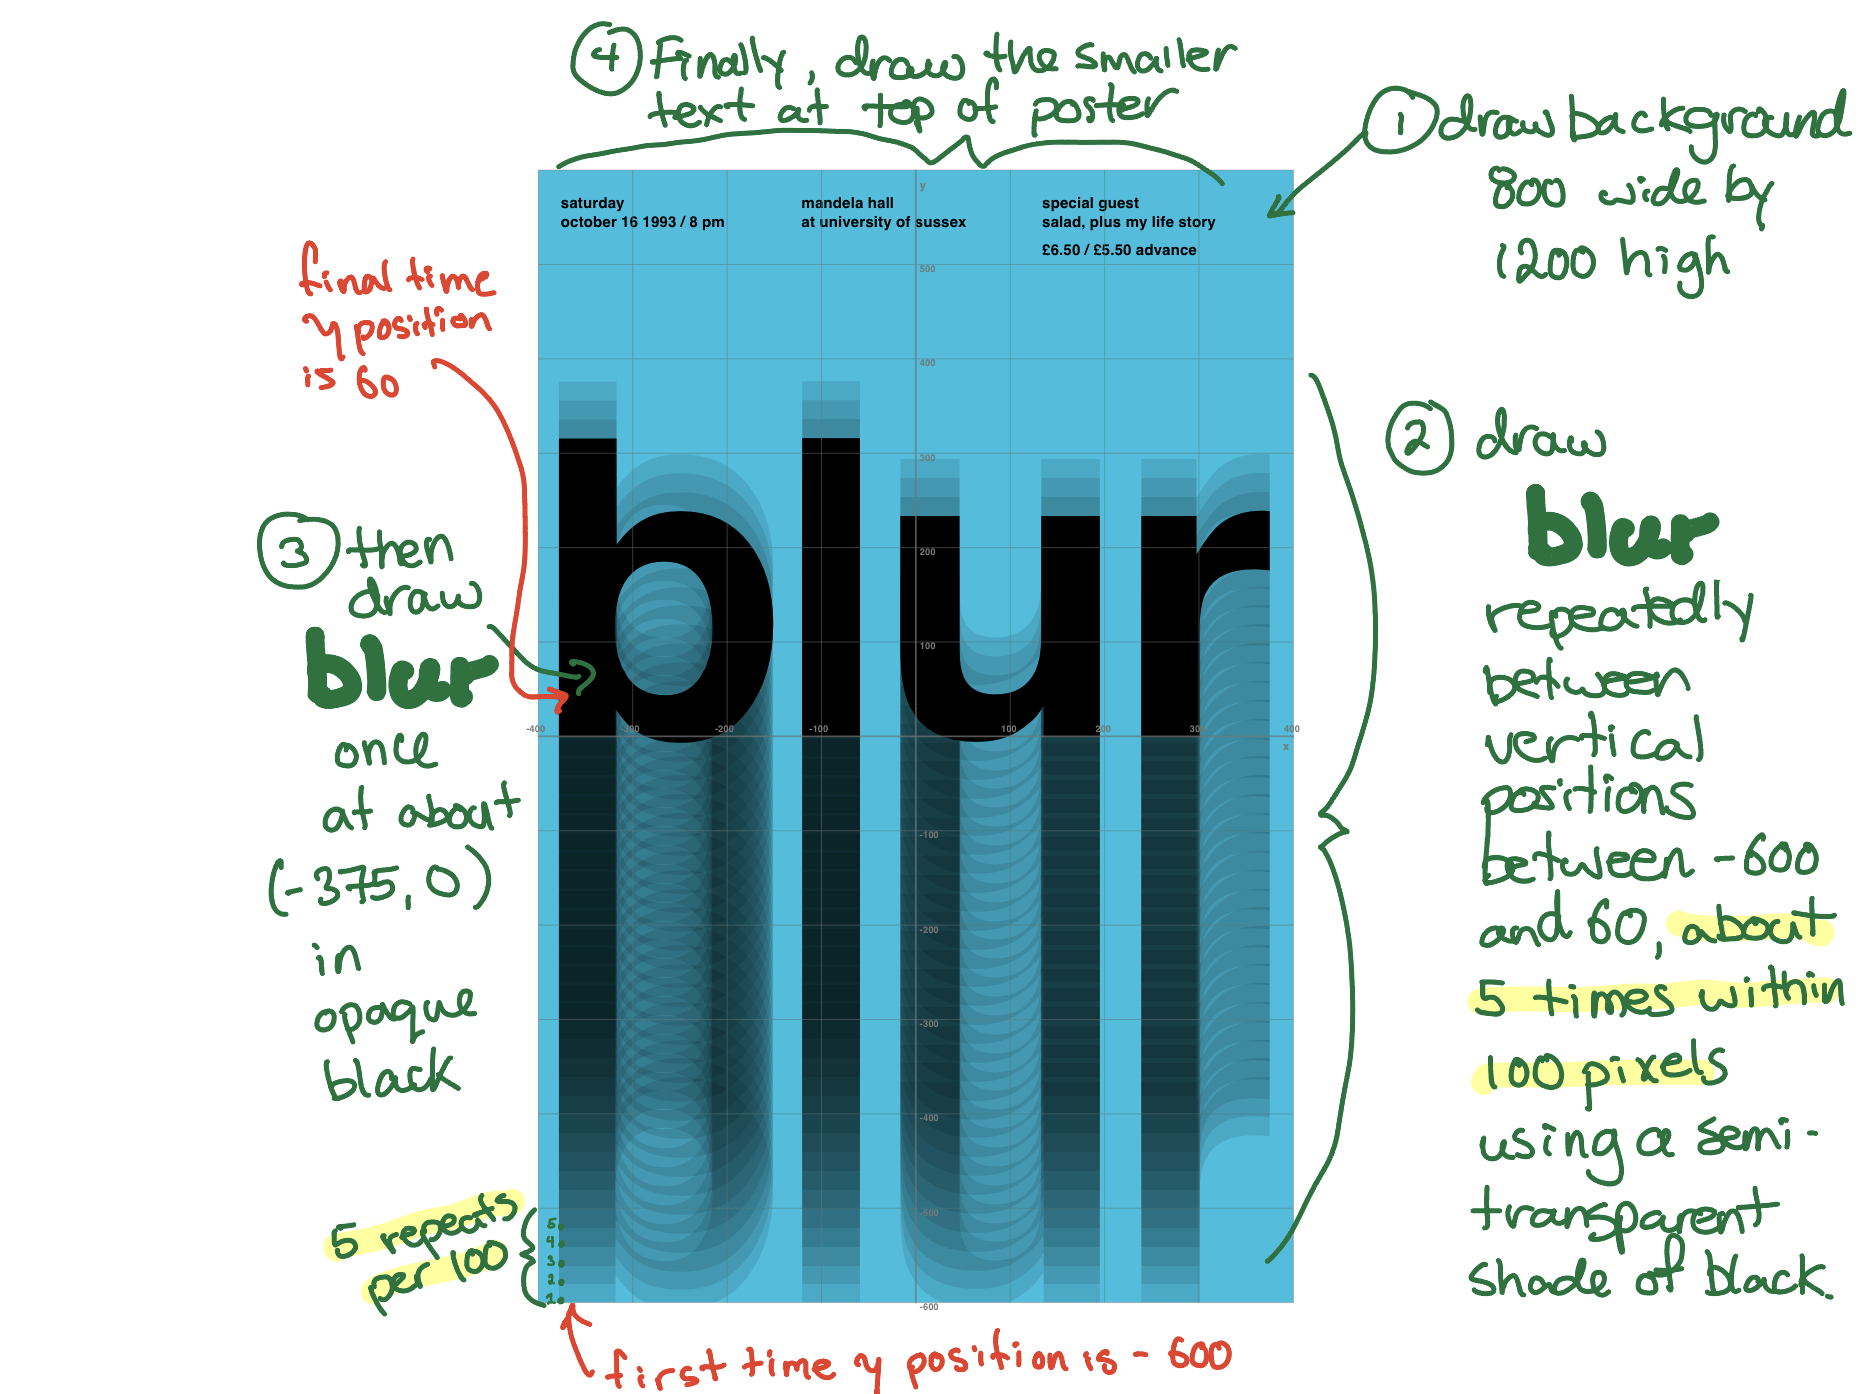
As well, we observed in our plan that within a vertical range of 100 pixels, it looks like the word blur is repeated five times. Note the lower left part of the plan, where a blue ☆ has been added:
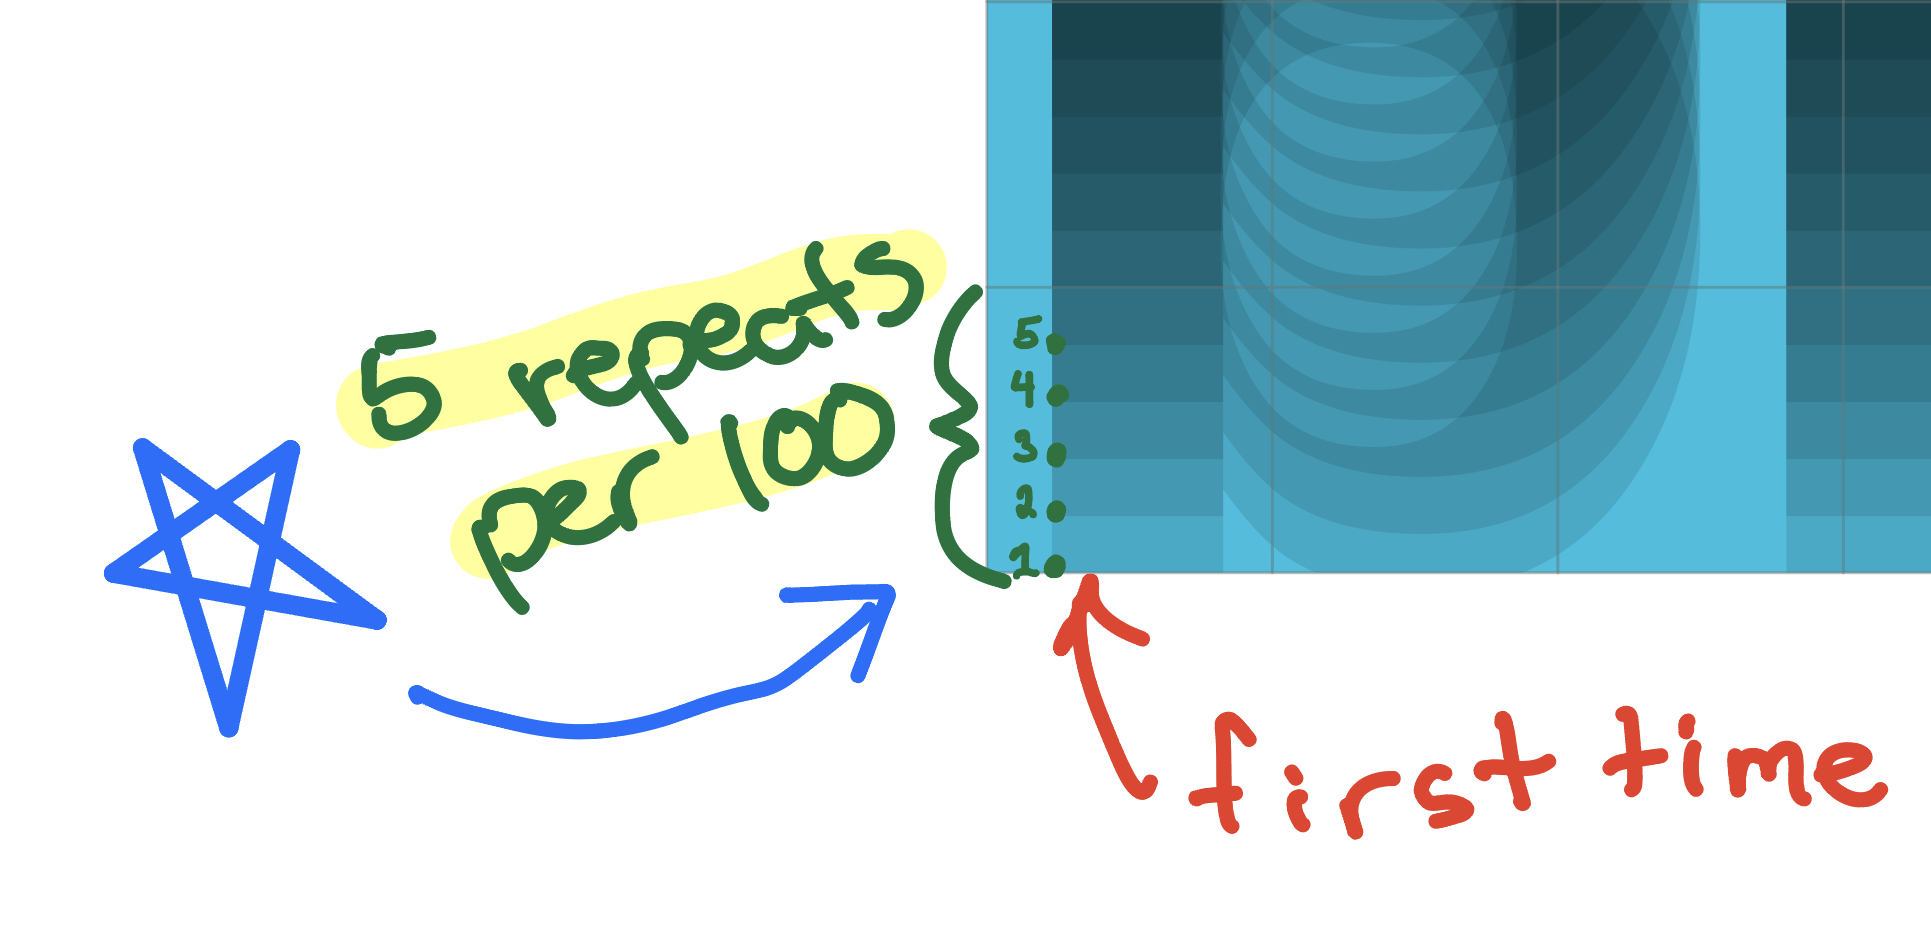
If the word blur is repeated 5 times within a height of 100 pixels, that means the change in position must be 20 pixels.
So the pattern of values would start as:
…and end all the way up at the top of the repeated text with:
We can express all of that with the following code added to our program after drawing the background color:
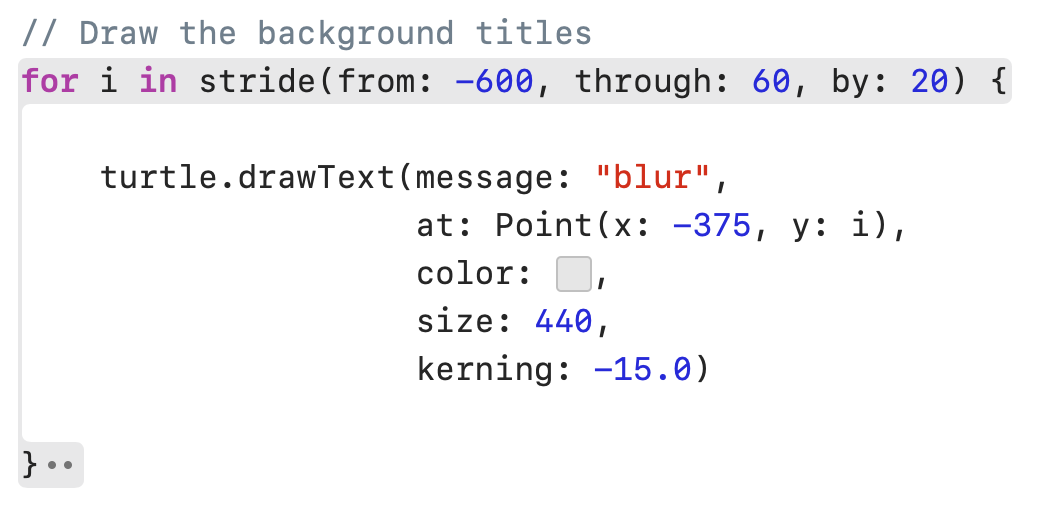
How to type that in is shown in the animation below. Some things to keep in mind:
- use the
tabkey to move between placeholders - it’s not necessary to add a
⮐or new line after each argument for thedrawTextcommand, but it can help to improve the readability of your code - the black text used for the title is transparent, with an opacity of about 10%
- the
kerningparameter accepts positive or negative values as an argument; negative values draw letters closer together and positive values push letters in the text further apart from one another
We have made good progress!
Draw the band name
According to the plan, the third step is to draw the name of the band, blur, once, in opaque black text:
This is straightforward.
Add the code shown here:
// Draw the primary title
turtle.drawText(message: "blur",
                at: Point(x: -375, y: 0),
                color: .black,
                size: 440,
                kerning: -15.0)
… just after the loop that draws the name of the band repeatedly:
Draw the subtitle text
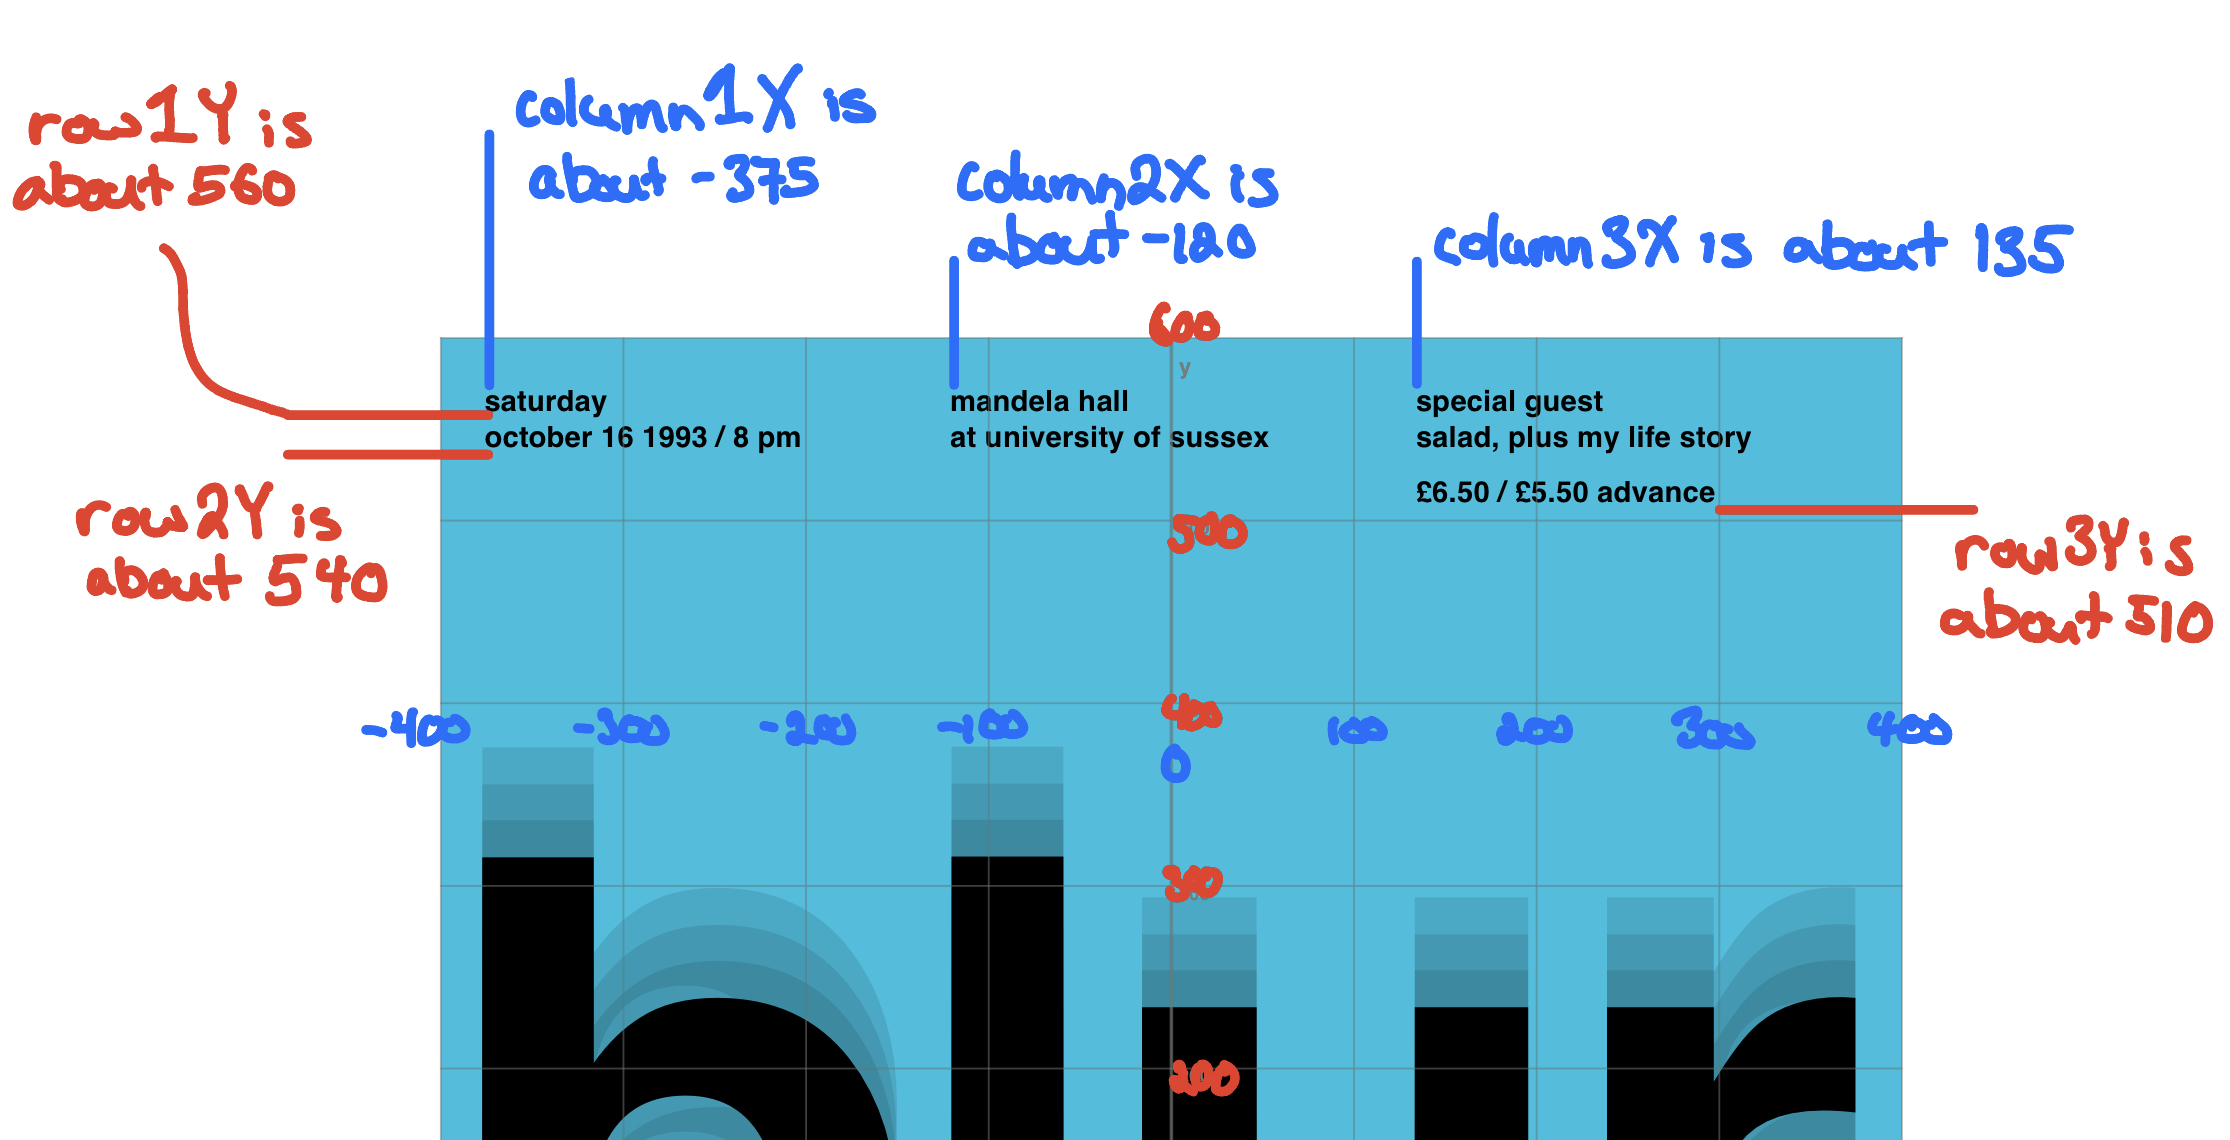
The fourth and final step is to draw all of the smaller text at the top the poster:
When you make a poster like this, a bit of trial and error is needed to get the exact values for the horizontal and vertical positions of the smaller text.
A good approach is to think of the smaller text as a grid. Analyse the poster more closely:
Use some constants (declared using the let keyword) to store values for the positions of each column of smaller text, and to store values for positions of each row of text:
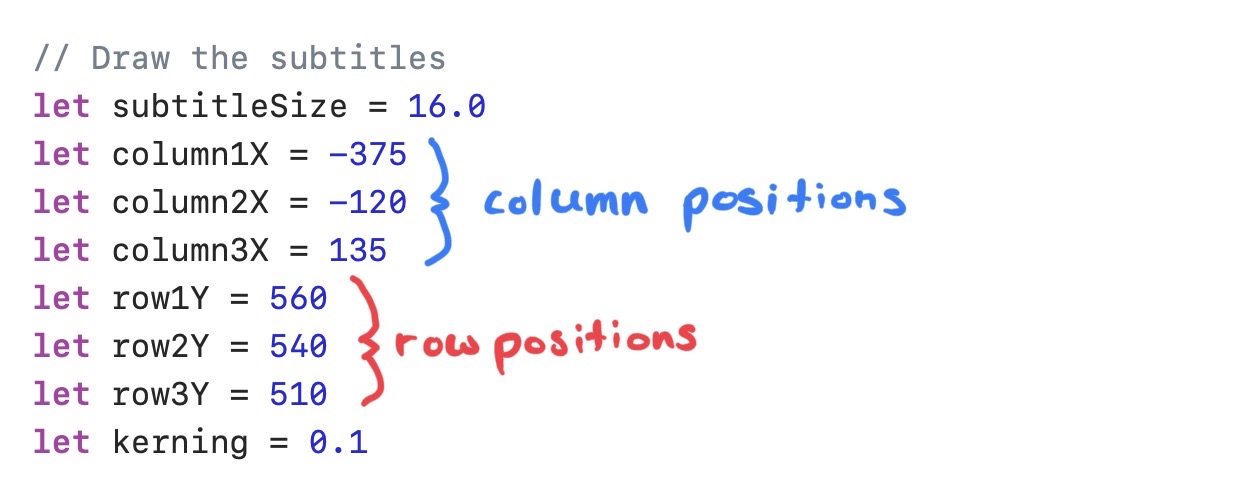
This makes it fast to adjust the positions of all text within a column or row, when you use those constants to position each piece of text:
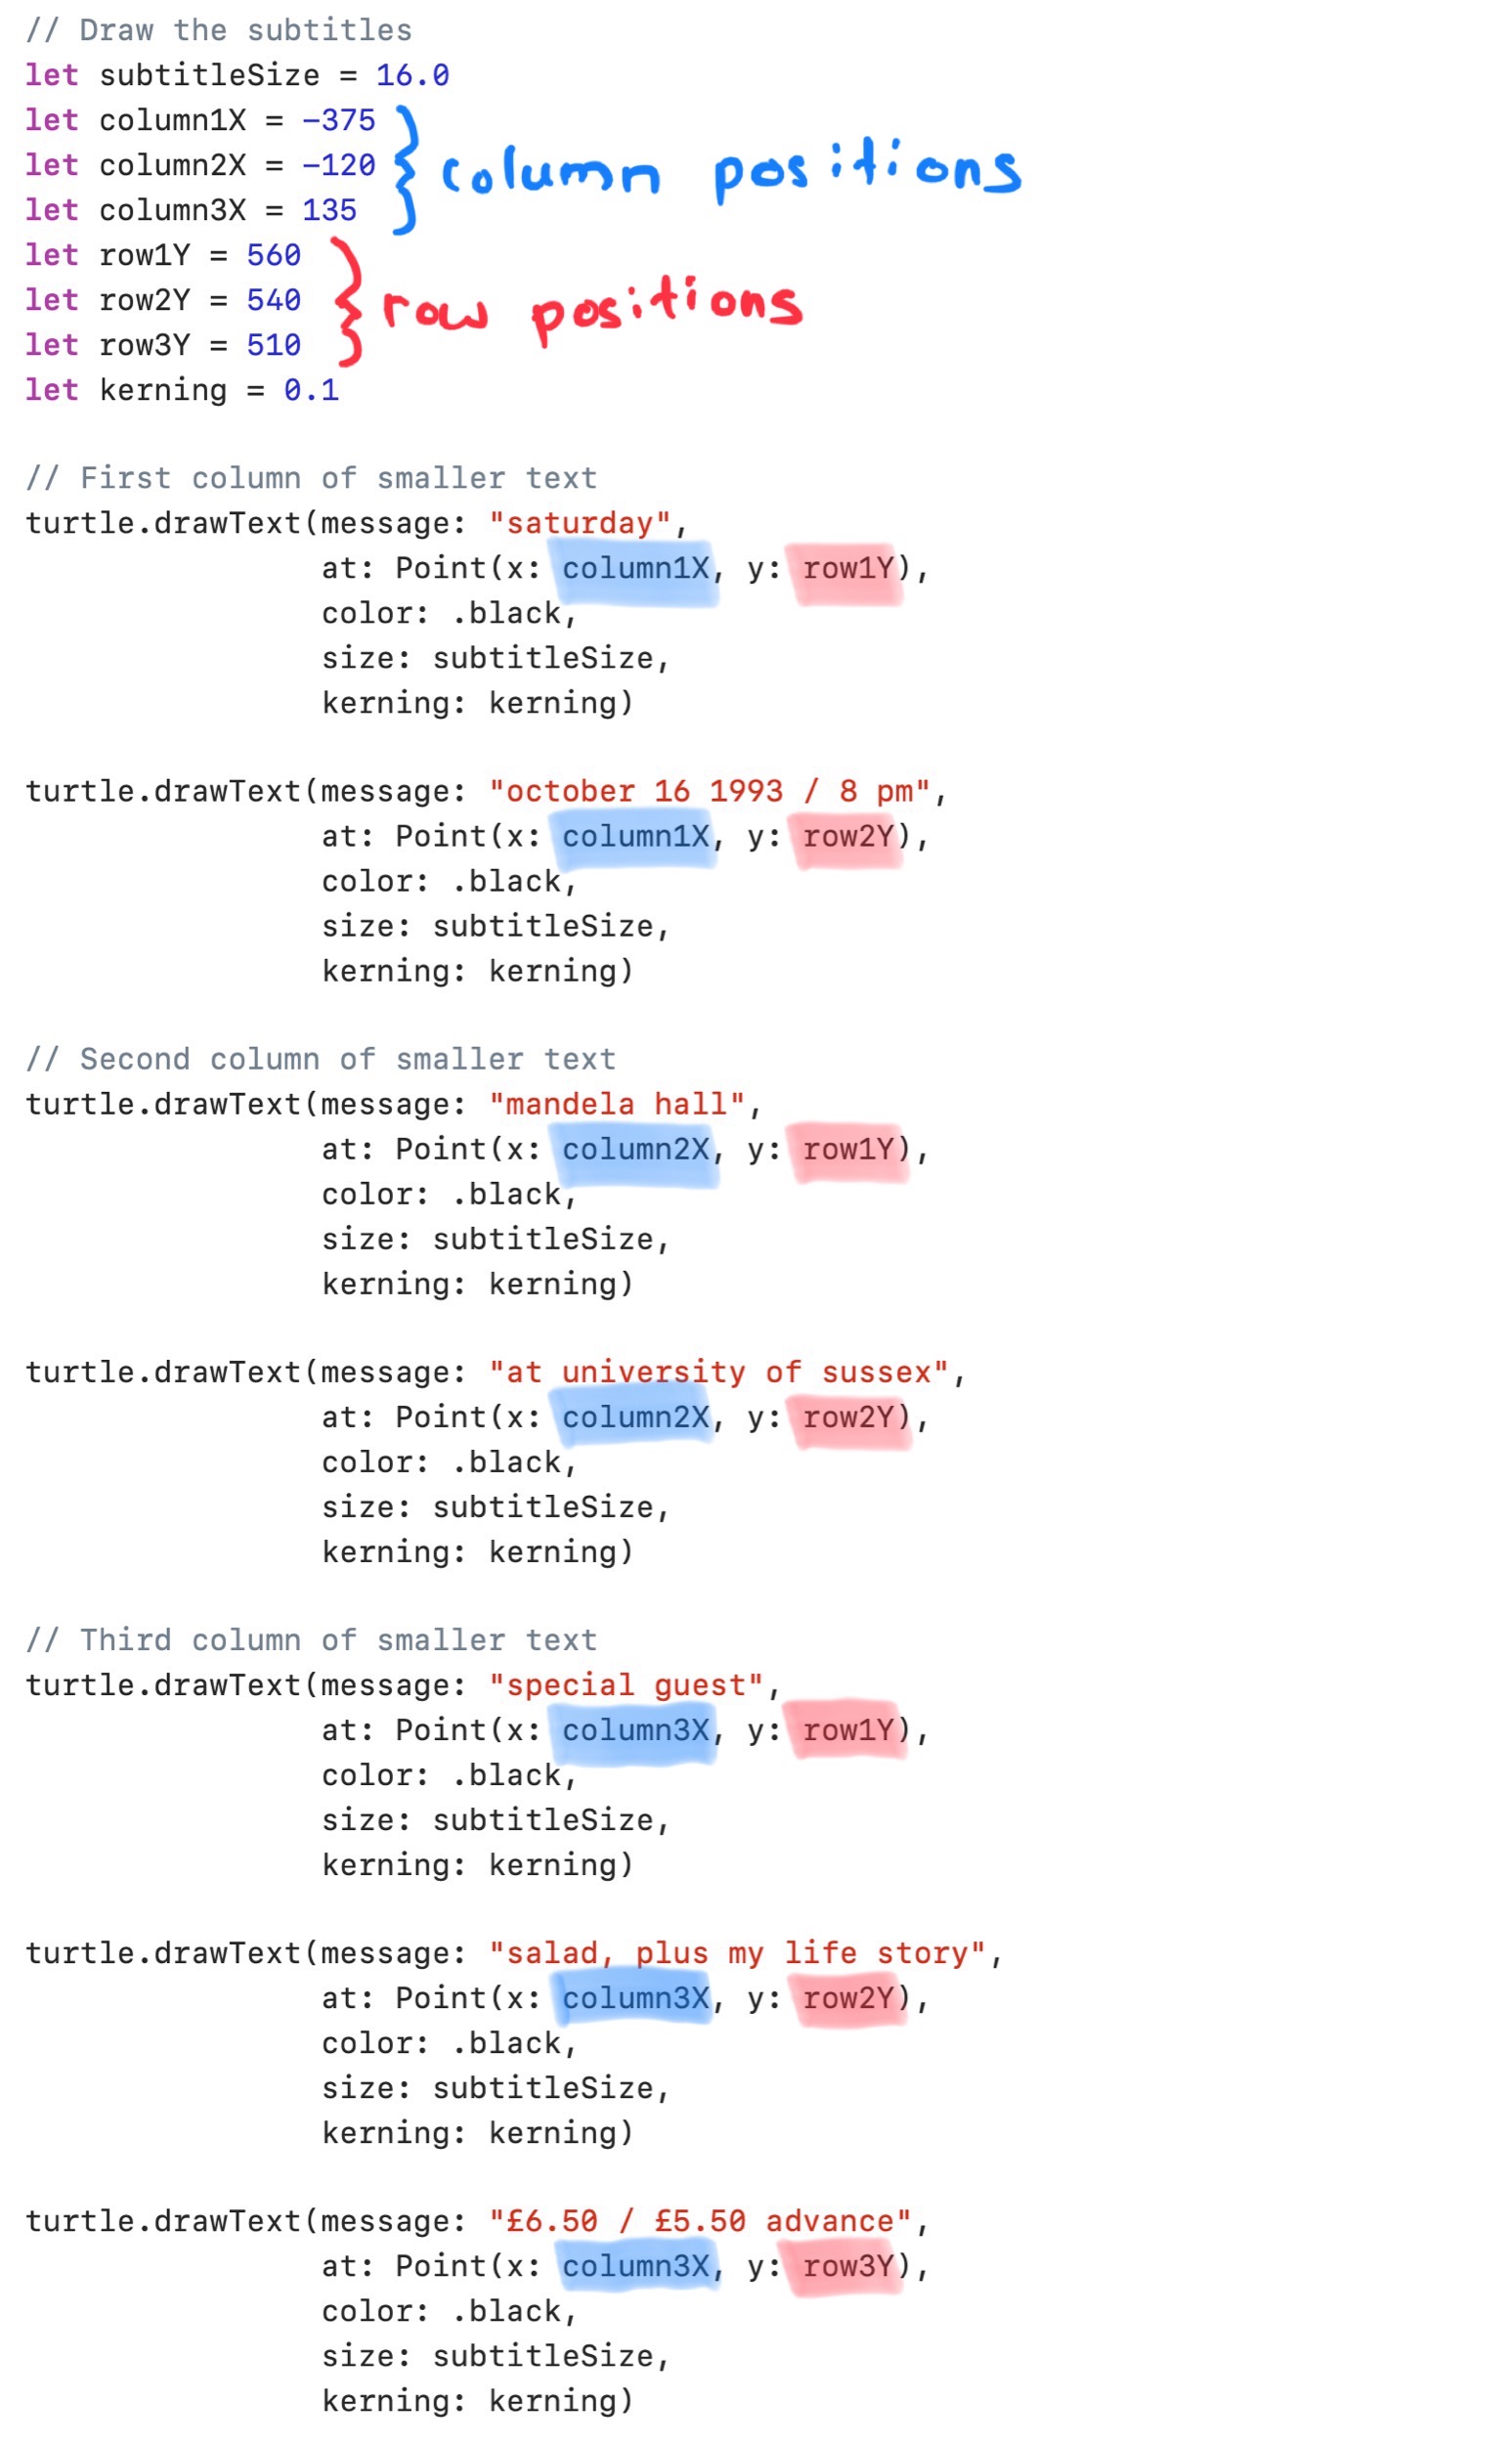
Add the code shown above to your program. It’s totally OK to copy and paste a block of code and adjust the values for each additional piece of text!
NOTE
A
kerningvalue of0.1is used to ever so slightly push the letters of each piece of smaller text away from one another.
All done! 🎉
To take your final look, comment out the line of code that draws the axes using the Command / (command and forward slash) keyboard shortcut:
It’s best to see your final product by looking at the PDF version:
Exercise: Sweating the details
Look very closely at the bottom of the poster.
Try zooming in on the bottom of the PDF file you’ve generated.
Do you notice anything that is not quite right?
Think in terms of overlapping shapes.
How could you fix the minor issue that you’ve spotted? 😎